

Bitcoin has confirmed a bullish flag breakout and is showing strong momentum, with technical targets near $140,000 and broader analyst scenarios stretching to $150,000–$181,000 within the next year, driven by rising institutional demand and increasing trading volume.
-
BTC confirmed a bullish flag breakout, projecting an immediate upside target near $140,000.
-
Trading volume and institutional inflows are rising, reinforcing bullish market control.
-
October seasonality and easing macro conditions support further upside; historical October returns average 20.62%.
Bitcoin bullish flag breakout signals upside to $140K; rising volume and institutional demand boost momentum—read expert analysis and track the targets now.
Bitcoin bulls drive momentum as breakout confirms a bullish flag pattern, with projections targeting $140K amid rising institutional demand.
- Bitcoin confirms a bullish flag breakout, projecting a potential upside target near $140,000.
- Rising trading volume and institutional demand reinforce Bitcoin’s strong bullish momentum and market control.
- Historical October gains and easing macro conditions support a continued rally toward the $150,000 level.
Bitcoin continues to show strong bullish momentum after breaking out of two descending channels within the past year. The cryptocurrency’s price stands at $122,279.88, as per CoinMarketCap data, with a 1.54% daily gain and trading volume increasing by 5.85% to $76.29 billion, signaling high market activity and strong investor participation.
What does the BTC chart breakout mean and what is the immediate price target?
Bitcoin’s bullish flag breakout indicates continuation of an existing uptrend, projecting an immediate upside target around $140,000. Technical structure shows higher highs and higher lows after two channel breakouts, supported by increased trading volumes that confirm active buying.
How did analysts interpret the technical setup?
Chart analysts, including Captain Faibik, identify a descending channel breakout from late 2022–April 2023 and a confirming breakout in October 2023 that formed a bullish flag continuation pattern. The pattern’s measured move places a near-term target near $140,000, assuming volume supports the advance.
$BTC #Bitcoin Bulls are in Complete Control.. 🔥📈 pic.twitter.com/QEWWLwItN8 — Captain Faibik 🐺 (@CryptoFaibik) October 4, 2025
The pattern demonstrates strong technical strength, showing that selling pressure was absorbed within the consolidation phase. Historical data confirms that after each breakout, Bitcoin maintained upward momentum, indicating sustained buying strength. Trading volumes during breakout phases provide factual confirmation of active market participation from both institutional and retail investors.
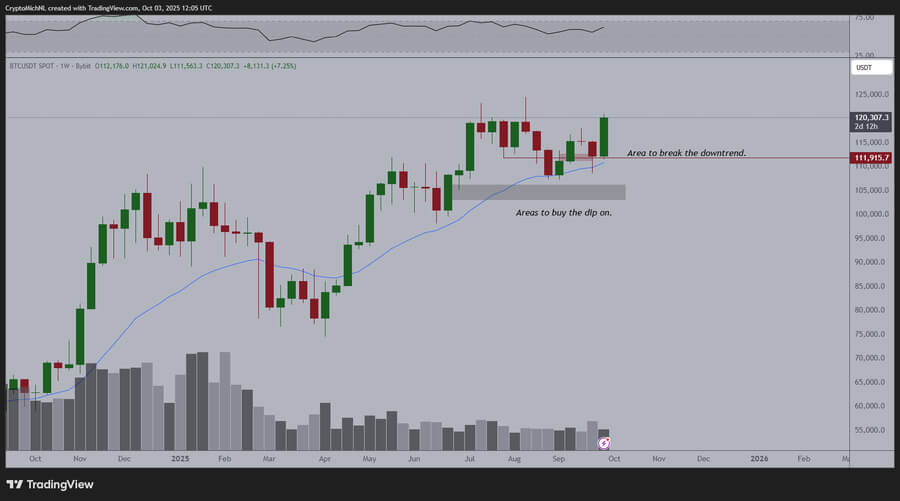 Source: MichaelvandePoppe (X)
Market expert Michael van de Poppe noted that “Bitcoin has held the 20-week moving average as support, broken the downtrend at $112,000, and is on track for the highest weekly close in history.” He added that recent price action included “a 7% weekly candle,” confirming renewed bullish control.
Why does institutional demand and seasonality matter for Bitcoin’s outlook?
Institutional inflows and historical seasonality amplify bullish momentum and help sustain higher price levels. Citigroup’s published forecast and other institutional commentary point to substantial upside scenarios, while seasonality data shows October historically favors Bitcoin performance.
According to Citigroup’s forecast (plain text citation), Bitcoin’s base case target sits near $181,000 with a bullish scenario up to $231,000 over a 12-month horizon. Institutional adoption, growing trading desks, and derivatives activity are cited as primary drivers in institutional research notes (plain text reference).
Data compiled by The Bull Theory on X shows Bitcoin closed October in the green in 10 of the last 12 years, with an average October return of 20.62%. Those historical tendencies, paired with improving macro conditions, support a scenario where Bitcoin could extend toward $150,000 in the coming quarter if institutional flows continue.
How are domestic retail premiums and macro policy influencing flows?
Analysts note domestic demand disparities—U.S. investors have paid premiums on certain exchanges—indicating stubborn retail participation. As the Federal Reserve signals a more cautious stance, macro liquidity conditions could remain supportive for risk assets, allowing institutional allocations to increase.
Frequently Asked Questions
What is the immediate technical target for Bitcoin after the bullish flag breakout?
BTC’s technical setup points to an initial upside target near $140,000 based on the measured move of the bullish flag, supported by rising volume and sustained buying pressure.
How likely is a sustained rally to $150K or higher?
With institutional demand rising, favorable October seasonality, and easing macro conditions, a rally to $150,000 is plausible within a quarter. Broader analyst scenarios range higher but depend on continued inflows and macro stability.
Key Takeaways
- Bullish Flag Breakout: Bitcoin’s technical breakout targets near $140,000 based on pattern measured move.
- Volume & Institutions: Rising trading volume and institutional demand validate the breakout’s strength.
- Seasonality & Macro: October seasonality and easing macro conditions support potential continuation to $150,000+.
Conclusion
Bitcoin’s confirmed bullish flag breakout and supportive volume profile indicate an immediate technical target near $140,000, with broader analyst scenarios extending to $150,000–$181,000 as institutional adoption rises. Monitor volume, moving averages, and macro flows for confirmation and trade accordingly. COINOTAG will update this analysis as new data emerges.





