

Solana resistance is concentrated near $240–$260; a weekly close above $260 would likely open a measured rally toward $520, while rejection risks rotation to $160 then $120. Traders should use clear stops and consider percentage-based dip buys or weekly-close confirmations.
-
Weekly close above $260 could target $520.
-
Mechanical 25% dip buys with 50–60% profit exits showed three recent winning cycles.
-
Support levels: $160 (near-term), $120 (deep buffer), $40 (long-term accumulation zone).
Solana resistance analysis: SOL near $240–$260; learn breakout and dip strategies to trade responsibly — read actionable levels and next steps.
Analysts outline Solana’s path as it nears key resistance, with breakout and dip based strategies guiding traders.
- Ali projects a weekly close above $260 could send Solana toward a $520 cycle peak.
- ZYN notes three straight gains using a 25% dip buy and 50%-60% rally exit method.
- Support sits at $160, with deeper buffers near $120 and $40 if rejection occurs.
What is Solana’s current resistance outlook?
Solana resistance sits in a cluster from $240 to $260, acting as the primary decision zone for the next directional move. A confirmed weekly close above $260 would signal stronger conviction and could open targets up to $520, while failed tests increase the probability of retests down to $160 or lower.
How could a weekly close above $260 affect SOL?
A weekly close above $260 would validate bullish order flow and technical structure, making subsequent targets at $280, $320, $360, $400, $440 and $520 plausible. These levels align with historical congestion and measured-extension methods; traders should expect phased advances with intermittent redistribution rather than uninterrupted rallies.
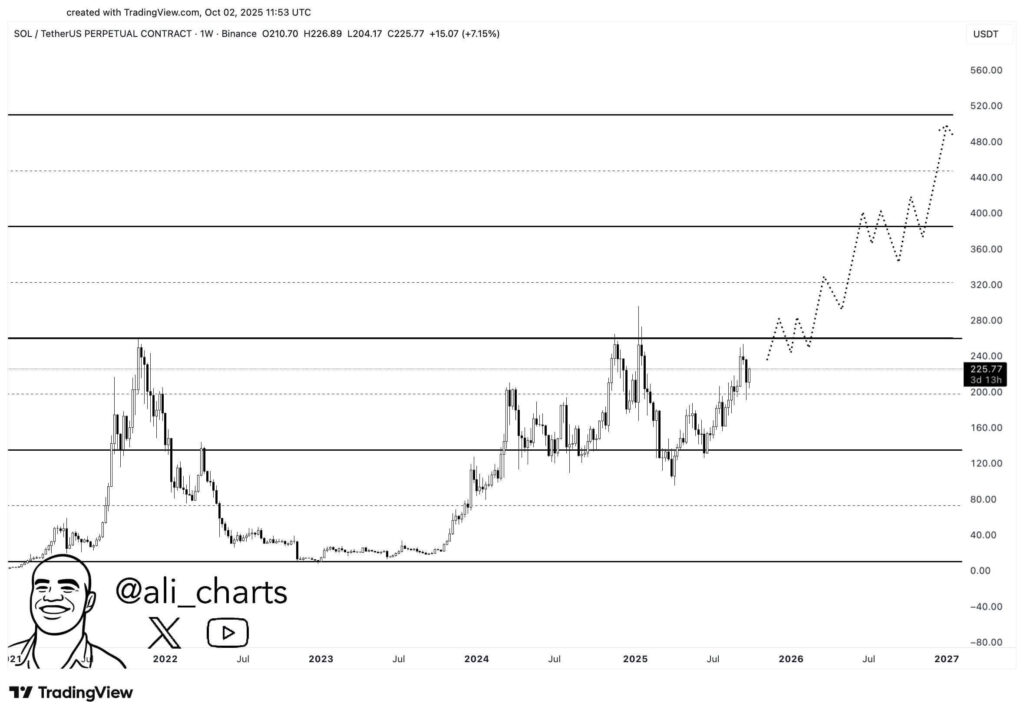 Source: Ali on X
Analyst Ali maps a stepwise progression through targeted checkpoints that reflect prior congestion. Each checkpoint—$280, $320, $360, $400, $440—serves as both profit-taking and re-accumulation zones ahead of a potential $520 cycle peak. This measured path suggests an orderly structure rather than erratic parabolic moves.
How should traders approach SOL at current resistance?
Traders can adopt one of two discipline-focused frameworks: confirmation-based entries or mechanical percentage entries. Each preserves capital while aligning risk to defined support and resistance.
- Weekly-close confirmation: Wait for a weekly close above $260 before scaling long; place stops below the breakout candle low.
- Mechanical dip strategy: Buy increments on 25% pullbacks from local highs and take partial profits at 50–60% rallies, as noted by analyst ZYN.
- Risk management: Use predefined stop zones at $160, $120, and $40 depending on time horizon and position size.
Both approaches emphasize discipline: confirmation reduces false-break risk; mechanical entries capitalize on recurring range behavior. Position size and stop placement should reflect individual risk tolerance and time frame.
Frequently Asked Questions
Is a dip-buy strategy validated by recent cycles?
Yes. ZYN’s observation of three straight favorable cycles using a 25% dip buy and 50–60% exit suggests recurring range dynamics. That said, traders must pair mechanical rules with stop discipline to mitigate regime changes or unexpected market shocks.
Key Takeaways
- Decision zone: $240–$260 is the critical resistance range determining next phase.
- Two valid approaches: Weekly confirmation vs. mechanical dip buys — both require clear stops.
- Defined supports: $160, $120, and $40 offer staged defensive levels for different time horizons.
Conclusion
Solana faces a pivotal moment as price tests the $240–$260 resistance cluster. Traders can prioritize a weekly close above $260 for breakout conviction or use disciplined percentage pullback buys with set exits. Monitor support zones and use strict risk management; this structured approach preserves capital while capturing potential upside.





