

XRP is trading near $3.03 and is positioned for a technical breakout: key resistance levels at $3.12–$3.40 must clear for a move to $3.60, while a sustained break and neckline support could project a longer-term target near $4.80.
-
XRP trading range compressed in a descending triangle with $2.70–$2.80 support and $3.60 as the immediate breakout target.
-
Fibonacci resistances at $3.12 (0.5), $3.25 (0.382) and $3.40 (0.236) align with recent rejection zones.
-
Long-term inverse head-and-shoulders structure sets a $4.80 potential if neckline support holds and volume confirms the breakout.
Meta description: XRP breakout setup front-loaded with primary keyword. XRP breakout nears $3.60; monitor Fibonacci resistances and volume — read technical outlook and next steps.
XRP trades at $3.03 with analysts eyeing $3.60 breakout as Fibonacci levels and long-term patterns point toward $4.80 potential.
- XRP consolidates in a descending triangle, with analysts targeting a potential $3.60 breakout.
- Fibonacci levels show key resistance at $3.12, $3.25, and $3.40 before a move higher.
- Long-term structure signals a possible path toward $4.80 if neckline support holds firm.
XRP is showing technical signs of strength as it trades near a critical breakout point. At the time of writing, XRP was trading at $3.03 after rebounding from September’s low of $2.71. Chart structures and Fibonacci levels are pointing toward a possible upward move toward the $3.60 mark.
What are the key technical breakout levels for XRP?
XRP breakout technicals center on the descending triangle that has contained price action since August. The immediate support range sits at $2.70–$2.80 while near-term resistance clusters at $3.12, $3.25 and $3.40. Clearing these zones increases the odds of a move to $3.60 within the triangle projection.
How do Fibonacci retracements shape short-term targets?
Fibonacci retracement plotted from $2.67 to $3.66 places the 0.618 at $2.93, a level buyers have defended. The 0.5 and 0.382 levels at $3.12 and $3.25 respectively map to recent rejection areas. The 0.236 near $3.40 is the final resistance band before the projected $3.60 breakout target.
$XRP looks set to break out of a triangle, with $3.60 as the target. pic.twitter.com/ldP7rMCCn4
— Ali (@ali_charts) October 2, 2025
Analyst Ali Martinez highlighted the triangle’s projection to $3.60, matching the July swing high. The pattern shows compressed volatility typical before decisive moves, meaning volume confirmation and a clean weekly close above the descending trendline would be meaningful confirmations.
What does long-term structure indicate for XRP?
Higher-timeframe structure suggests a potential inverse head-and-shoulders pattern with a neckline near current resistance bands. If support above the neckline holds and buyers sustain momentum, the measured target from that structure sits around $4.80.
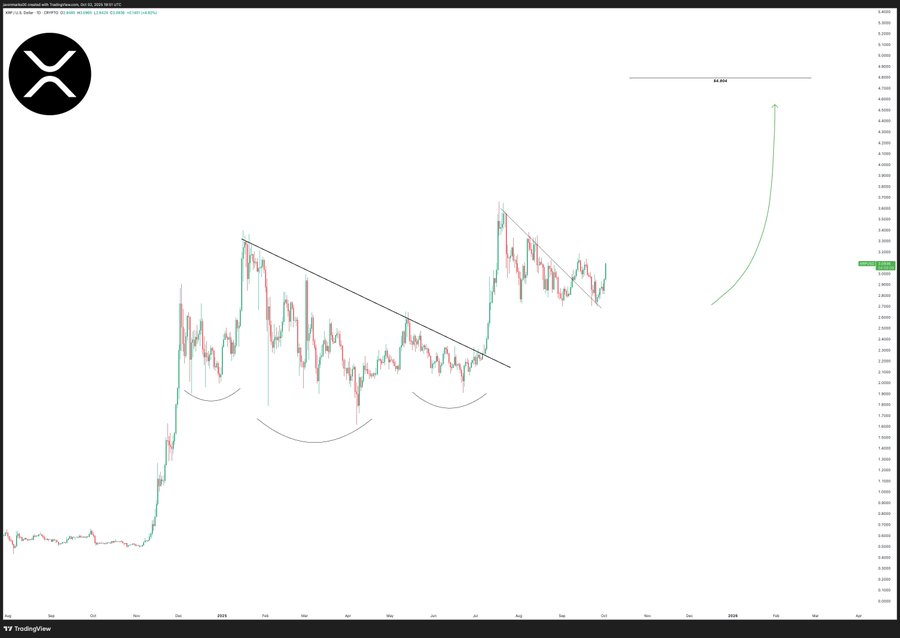 Source: JavonMarks (X)
Market participation supports the technical case: spot and futures activity show elevated open interest and near $7 billion in trading volume across major venues. Rising volume during a breakout would add conviction to extension targets in the $3.85–$4.00 area and the longer-term $4.80 projection.
How should traders monitor the breakout and manage risk?
Traders should watch for a weekly close above the descending trendline and $3.12–$3.25 resistance band, confirmed by rising volume and open interest. Risk management should prioritize keeping stops below the $2.70–$2.80 support zone and scaling position size ahead of major resistance tests.
Frequently Asked Questions
Will XRP reach $3.60 soon?
Short-term price action favors a move to $3.60 if XRP breaks above the descending trendline and clears resistance at $3.12–$3.40 with volume confirmation. The probability increases with a weekly close above the triangle’s upper boundary.
Is $4.80 a realistic long-term target for XRP?
Yes. A confirmed inverse head-and-shoulders on higher timeframes points to a measured target near $4.80, provided the neckline holds and macro liquidity conditions remain supportive.
Key Takeaways
- Triangle consolidation: Price compressed between $2.70–$2.80 support and a descending trendline, signaling a potential breakout.
- Fibonacci alignment: Resistance at $3.12, $3.25 and $3.40 are key levels to clear for a move to $3.60.
- Volume & structure confirm: Rising volume and a weekly close above the trendline would support extensions toward $3.85–$4.00 and $4.80.
Conclusion
Front-loaded technical signals for the XRP breakout show a clear short-term path to $3.60 if resistance zones and the descending trendline are overcome. Long-term structure offers a $4.80 upside scenario contingent on neckline support and volume confirmation. Monitor Fibonacci levels, volume, and weekly closes for actionable signals.
Published: 2025-10-03 · Updated: 2025-10-03 · Author: COINOTAG





