Bitget App
Trade smarter
Buy cryptoMarketsTradeFuturesStocksEarnInstitutionAI & More
XRP Steadies at $2.93 as Market Awaits Break Beyond Tight Trading Range

XRP Steadies at $2.93 as Market Awaits Break Beyond Tight Trading Range

CryptonewslandCryptonewsland2025/10/02 20:42
By:by Vee Peninah
  • XRP is currently trading at $2.93 showing a 24h gain of 3.1%, with a support at $2.82 and a resistance of $2.95.
  • RSI values around 62 indicate stable demand whereas the MACD line is slightly positive indicating controlled momentum.
  • 7-day and 30-day moving averages, at $1.86 and $0.95, respectively, are lower than the current price, which indicates a powerful recent performance of XRP.

XRP maintained steady price action with the token trading at $2.93 after posting a 3.1% gain in 24 hours . The latest trend was triggered by the fact that short-term technical indicators neared an important resistance line. The XRP was also trading at 0.00002520 BTC as reflected in market data; this is a minor 0.1% increase. 

The past day’s trading has remained within the range of $2.82 to $2.95 indicating that both support and resistance levels have been pressurized. It is worth noting that the recent chart readings indicated a tightening of the market elements that may dictate the future of the token.

Support and Resistance Levels

XRP was supported at $2.82, which has already become the cornerstone of the stable price in the latest sessions. An upwards movement was still limited by a ceiling at $2.95, thus supporting a short-term period of consolidation. Both levels carried added weight due to repeated testing in recent hours. The narrow range underlines a market in waiting, with limited space before a breakout or retracement.

#Xrp Is About To Explode… Last Chance🃏 pic.twitter.com/MVBRQoqH2k

— XRPJoker🃏 (@joker_xrp) October 2, 2025

Transitioning to moving averages, the short-term seven-day moving average registered at $1.86, showing clear distance from current levels. The 30-day moving average printed at $0.95, also trailing far below market value. These gaps highlighted XRP’s sharp upward surge over recent sessions.

Momentum Indicators Show Steady Demand With Limited Volatility

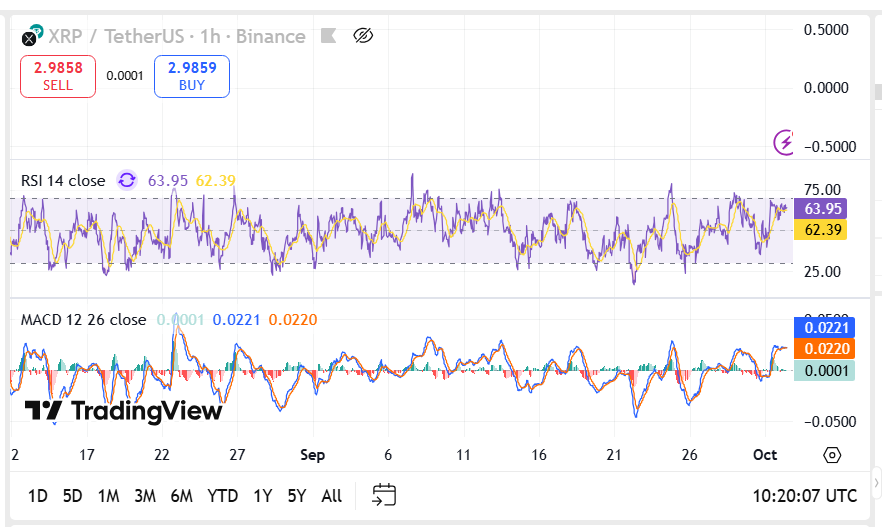
The Relative Strength Index stood at 62.20, while shorter-frame readings placed the value at 67.60. Both figures suggested the asset stayed below overbought levels, although trending higher. This indicated consistent demand but not extreme buying conditions.
XRP Steadies at $2.93 as Market Awaits Break Beyond Tight Trading Range image 0 XRP Steadies at $2.93 as Market Awaits Break Beyond Tight Trading Range image 1 Source: TradingView

The Moving Average Convergence Divergence (MACD) line posted at 0.0220, maintaining a slim positive difference against the signal line. The data implied momentum remained slightly tilted upward, yet without major divergence. These indicators combined illustrated steady activity, though with restrained volatility compared to the prior spike.

XRP Trades Within a Narrow Range as Key Levels Shape Market Outlook

Market positioning showed XRP holding above key moving averages while hovering just under a capped resistance zone. The present structure suggested that market participants were closely watching the $2.95 resistance. At the same time, the defense of $2.82 provided a near-term anchor.

#Xrp Is About To Explode… Last Chance🃏 pic.twitter.com/MVBRQoqH2k

— XRPJoker🃏 (@joker_xrp) October 2, 2025

The volumes and liquidity concentrations at such levels have strengthened their significance. The price may be kept in the range of $2.82 and $2.95 in case the resistance zone is maintained. However, support levels of the holding firm underscored that buyers continued to defend lower territory, keeping conditions steady.

As the charts indicated, XRP traded in a narrow corridor with measured momentum . With short-term signals aligned, the market awaited clearer direction beyond the established price levels.


0
0

Disclaimer: The content of this article solely reflects the author's opinion and does not represent the platform in any capacity. This article is not intended to serve as a reference for making investment decisions.

Understand the market, then trade.
Bitget offers one-stop trading for cryptocurrencies, stocks, and gold.
Trade now!

You may also like

Wall Street giants collectively raise rate hike forecasts, US Treasury futures continue to fall, gold drops over 1% to break 4000

After the US October CPI exceeded expectations, Goldman Sachs and Nomura added a forecast for an interest rate hike in March next year, while Deutsche Bank included a forecast for a rate hike in January next year. Currently, the market has fully priced in a 25 basis point rate hike in December, with a 13% probability for a 50 basis point hike. On Wednesday, the US Treasury spot market was closed, but Treasury futures continued to fall, with corresponding yields rising by about 2 to 4 basis points, and spot gold came under pressure, dropping by 1.1%.

华尔街见闻•2026/11/11 21:18
Wall Street giants collectively raise rate hike forecasts, US Treasury futures continue to fall, gold drops over 1% to break 4000

No Need to Worry About the Cooling Down of AI Data Center Construction? The US Import Boom Is Unlikely to Subside in the Short Term, Real Impact May Come in 2029

It takes an average of 4.8 years from finalizing investment to starting construction of a data center project, and an additional 2.6 years from construction start to becoming operational. Servers usually cannot be installed until after the building structure and racks are completed. For trade partners such as Taiwan (China), South Korea, and Mexico who rely on US data center supply chain demand, the inertia in construction timelines provides at least a one- to two-year buffer for future exports.

华尔街见闻•2026/11/11 21:18
No Need to Worry About the Cooling Down of AI Data Center Construction? The US Import Boom Is Unlikely to Subside in the Short Term, Real Impact May Come in 2029

Federal Reserve Major Debate: When Should the Tenure of “Number Three” Williams End?

The main point of contention is whether Williams should step down in June 2028, upon completing a full 10-year term, or in June 2027, when he reaches the mandatory retirement age of 65. Analysts point out that the Federal Reserve Board holds ultimate discretion; if he leaves early, Fed Chair Waller would be able to assert greater control over the appointment to this critical position. However, forcing Williams to shorten his term could easily be interpreted as political manipulation. Williams himself is expected to serve until June 2028.

华尔街见闻•2026/11/11 21:18
Federal Reserve Major Debate: When Should the Tenure of “Number Three” Williams End?
