
Ethereum Open Interest Sees Sharpest Reset Since 2024 As Price Drops Below $4,000

Ethereum is undergoing one of the most significant resets in over a year, caused by its price breaking below $4,000. This retest has been most visible in futures open interest, where billions of dollars in positions have been wiped out across major exchanges. This rapid unwinding comes as a correction move to weeks of excessive leverage during uptrends that had pushed derivatives activity to unsustainable levels.
Massive Open Interest Wipeout Across Major Exchanges
The most recent Ethereum price correction was a broader market reset rather than a mere dip, with leveraged traders facing the brunt of the losses. Data shows that Ethereum’s open interest experienced a steep downfall over the just concluded week across multiple crypto exchanges. According to data from on-chain analytics platform CryptoQuant, billions worth of Ethereum positions were wiped out last week, with Binance leading the downturn with the steepest monthly average drop.
Ethereum’s slide under the $4,000 mark proved to be the breaking point for over-leveraged traders. The move unleashed a wave of liquidations across derivatives markets, compounding selling pressure.
Data shows that more than $3 billion was erased on September 23 through Binance alone, followed by over $1 billion just a day later. Bybit also shed $1.2 billion in positions, while OKX recorded a $580 million decline. The sharp reduction is visible in aggregate open interest, which has slumped to its lowest level since early 2024.
As the chart data shows, futures leverage and open interest were closely tied to the price rally in July and August, and at the same time, it declined in lockstep with the price.
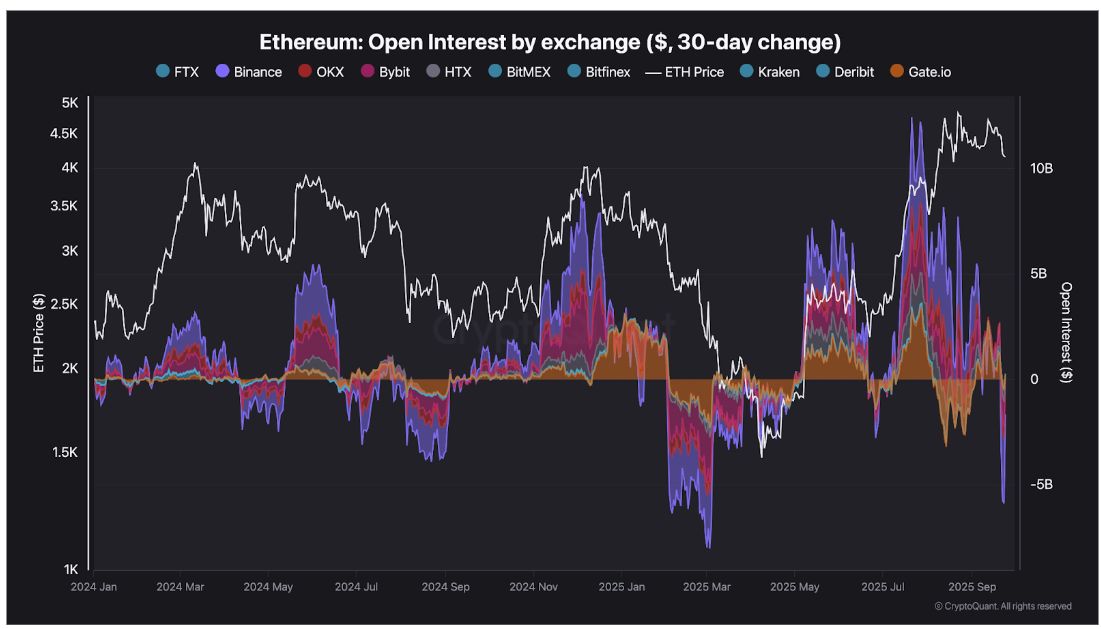
Ethereum Open Interest by exchange
Spot Ethereum ETF Outflows Add To Market Strain
Ethereum’s break below $4,000 and the decline in open interest coincides with a week of heavy outflows from spot Ethereum ETFs in the United States. According to data from Farside Investors, $795.56 million flowed out over five trading days last week, which is the largest weekly exodus since the products launched.
The sell-off intensified toward the end of the week, with Thursday recording $251.2 million in outflows, followed by another $248.4 million on Friday. Waning institutinal participation contributed massively to the sell-side pressure, with investors showing caution amid uncertainty over whether regulators will allow staking features in these ETFs. This synchronized exit from both derivatives and institutional products has amplified volatility, creating a convergence of pressure across Ethereum’s trading ecosystem.
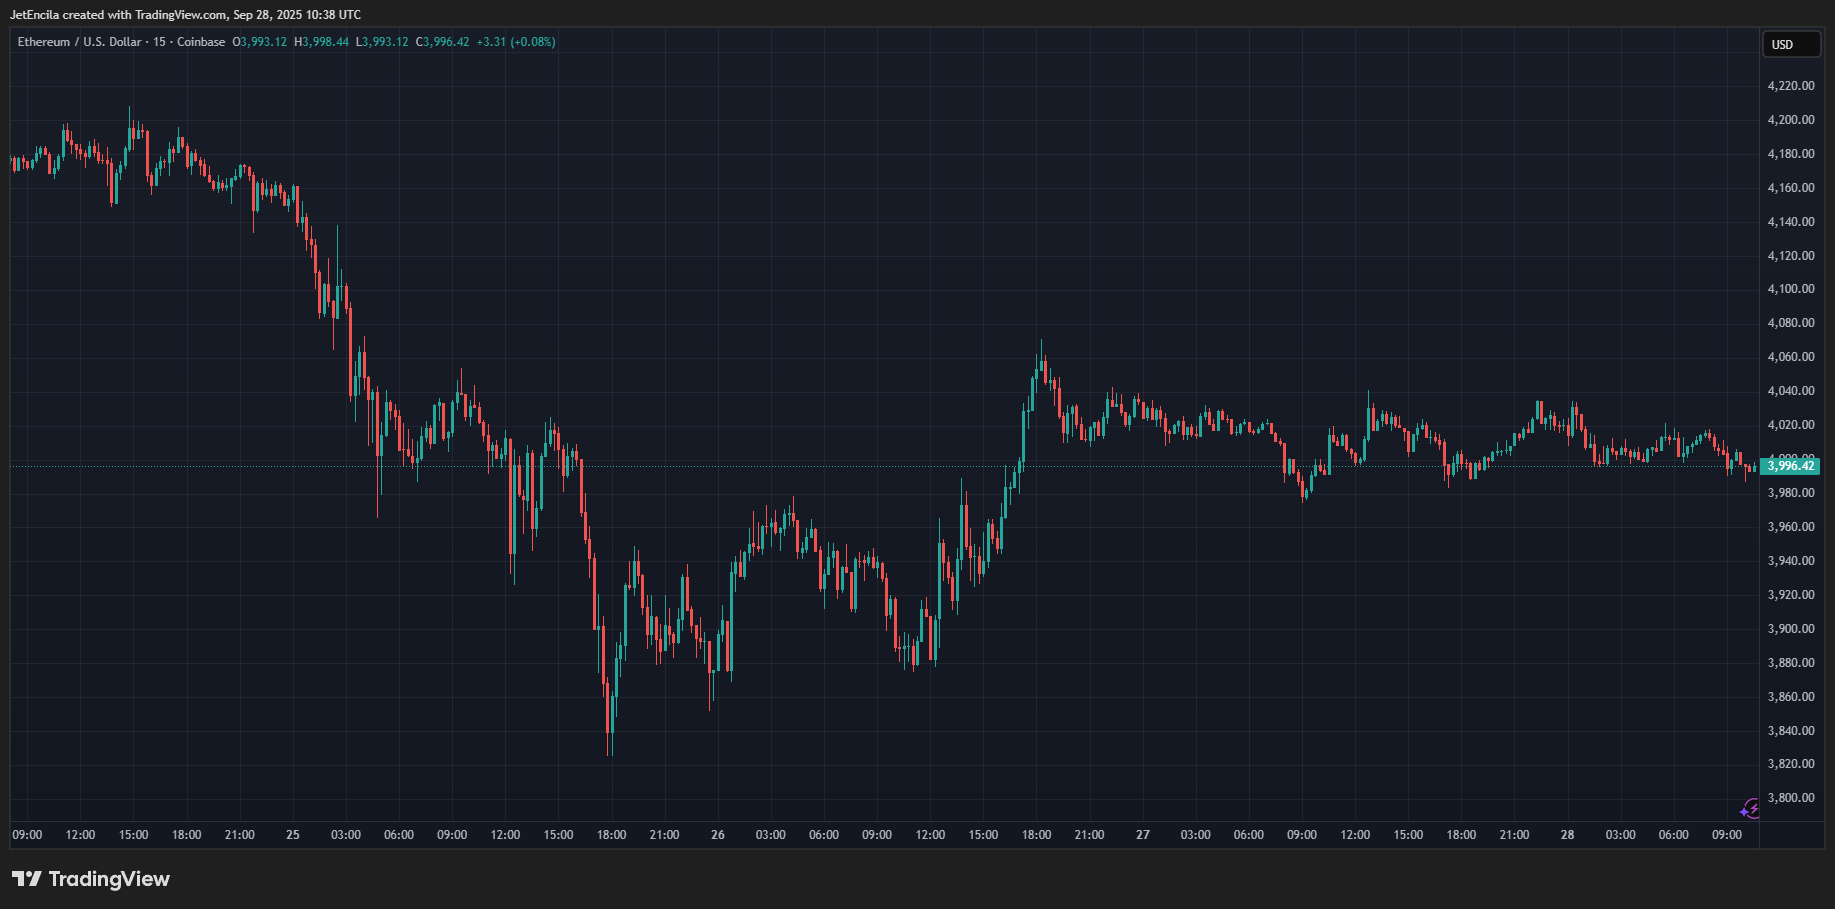
After dipping as low as $3,845, ETH bulls have managed to hold above $3,800. At the time of writing, Ethereum is trading at $4,002. Despite this attempt to regain stability, the leading altcoin is still down by about 10% in a weekly timeframe, considering it was trading around $4,490 this time last week. The bullish scenario now lies in whether ETH can reclaim and sustain a move above $4,000.
Featured image from Unsplash, chart from TradingView
Disclaimer: The content of this article solely reflects the author's opinion and does not represent the platform in any capacity. This article is not intended to serve as a reference for making investment decisions.
You may also like

Wall Street giants collectively raise rate hike forecasts, US Treasury futures continue to fall, gold drops over 1% to break 4000
After the US October CPI exceeded expectations, Goldman Sachs and Nomura added a forecast for an interest rate hike in March next year, while Deutsche Bank included a forecast for a rate hike in January next year. Currently, the market has fully priced in a 25 basis point rate hike in December, with a 13% probability for a 50 basis point hike. On Wednesday, the US Treasury spot market was closed, but Treasury futures continued to fall, with corresponding yields rising by about 2 to 4 basis points, and spot gold came under pressure, dropping by 1.1%.

No Need to Worry About the Cooling Down of AI Data Center Construction? The US Import Boom Is Unlikely to Subside in the Short Term, Real Impact May Come in 2029
It takes an average of 4.8 years from finalizing investment to starting construction of a data center project, and an additional 2.6 years from construction start to becoming operational. Servers usually cannot be installed until after the building structure and racks are completed. For trade partners such as Taiwan (China), South Korea, and Mexico who rely on US data center supply chain demand, the inertia in construction timelines provides at least a one- to two-year buffer for future exports.

Federal Reserve Major Debate: When Should the Tenure of “Number Three” Williams End?
The main point of contention is whether Williams should step down in June 2028, upon completing a full 10-year term, or in June 2027, when he reaches the mandatory retirement age of 65. Analysts point out that the Federal Reserve Board holds ultimate discretion; if he leaves early, Fed Chair Waller would be able to assert greater control over the appointment to this critical position. However, forcing Williams to shorten his term could easily be interpreted as political manipulation. Williams himself is expected to serve until June 2028.

Crypto prices
More


