
XLM Price at Risk of 40% Correction Amid Looming Bearish Crossover

Stellar’s price action looks fragile despite market rallies. With social dominance falling and a bearish crossover nearing, XLM risks deeper losses if support fails.
While the broader crypto market rallied in August, XLM often moved in the opposite direction. Over the past month, the XLM price has dropped 11%, and in the last 24 hours alone, it slipped another 4.2%, more than the market’s overall 2% decline.
These repeated dips have left traders wondering whether a recovery is even on the table. On-chain and technical patterns suggest a downtrend, unless bulls can step in. Stellar may be staring at new lows if one bearish crossover confirms.
Social Dominance Drop Aligns With Bearish Crossover Risk
The first warning comes from social dominance, which measures how much of the crypto conversation a coin commands compared to the rest of the market. For Stellar, attention has fallen sharply — from 1.71% on July 13 to just 0.51% at press time, a near 70% decline.
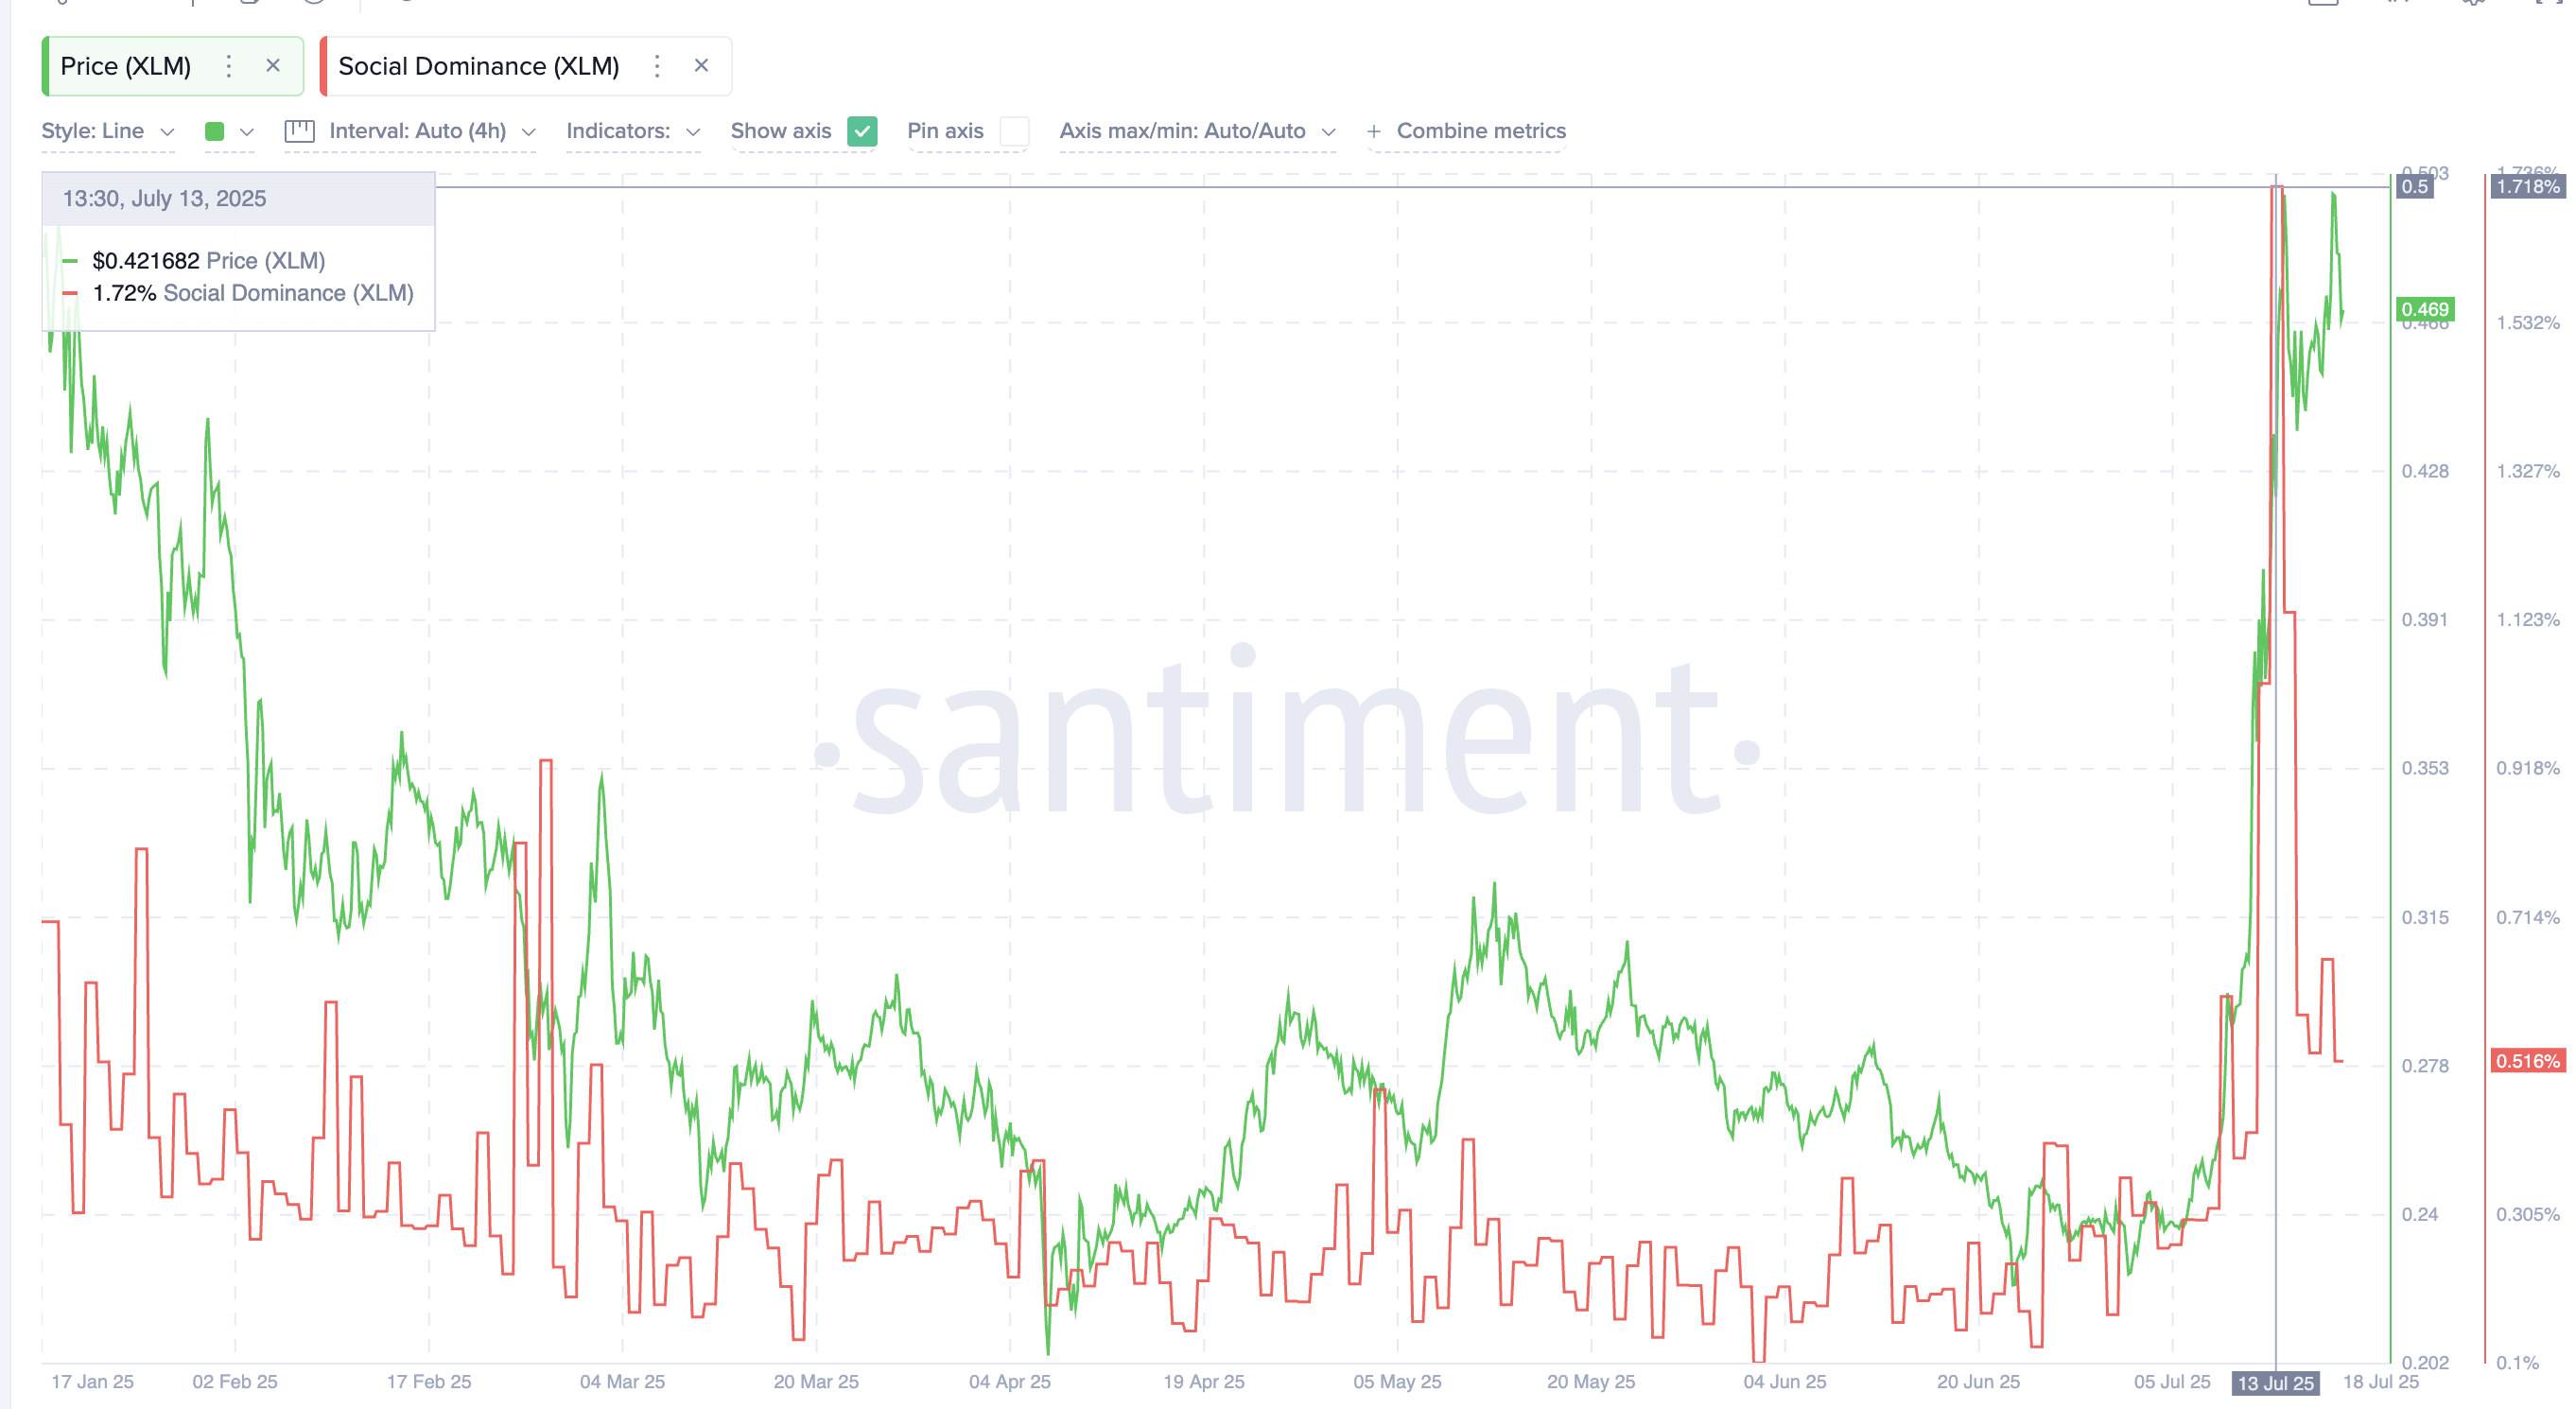 XLM Social Dominance Drops Over 70%:
History shows that when social dominance forms this type of low pattern, it often lines up with extended corrections. For instance, in March, a similar collapse was followed by the XLM price drop from $0.35 to $0.25, close to 30%.
If the Stellar social dominance and price correlation play out again, a similar drop might not be out of the equation.
Moreover, on the 4-hour chart, the 50 EMA or Exponential Moving Average (orange line) is about to cross below the 200 EMA (blue line).
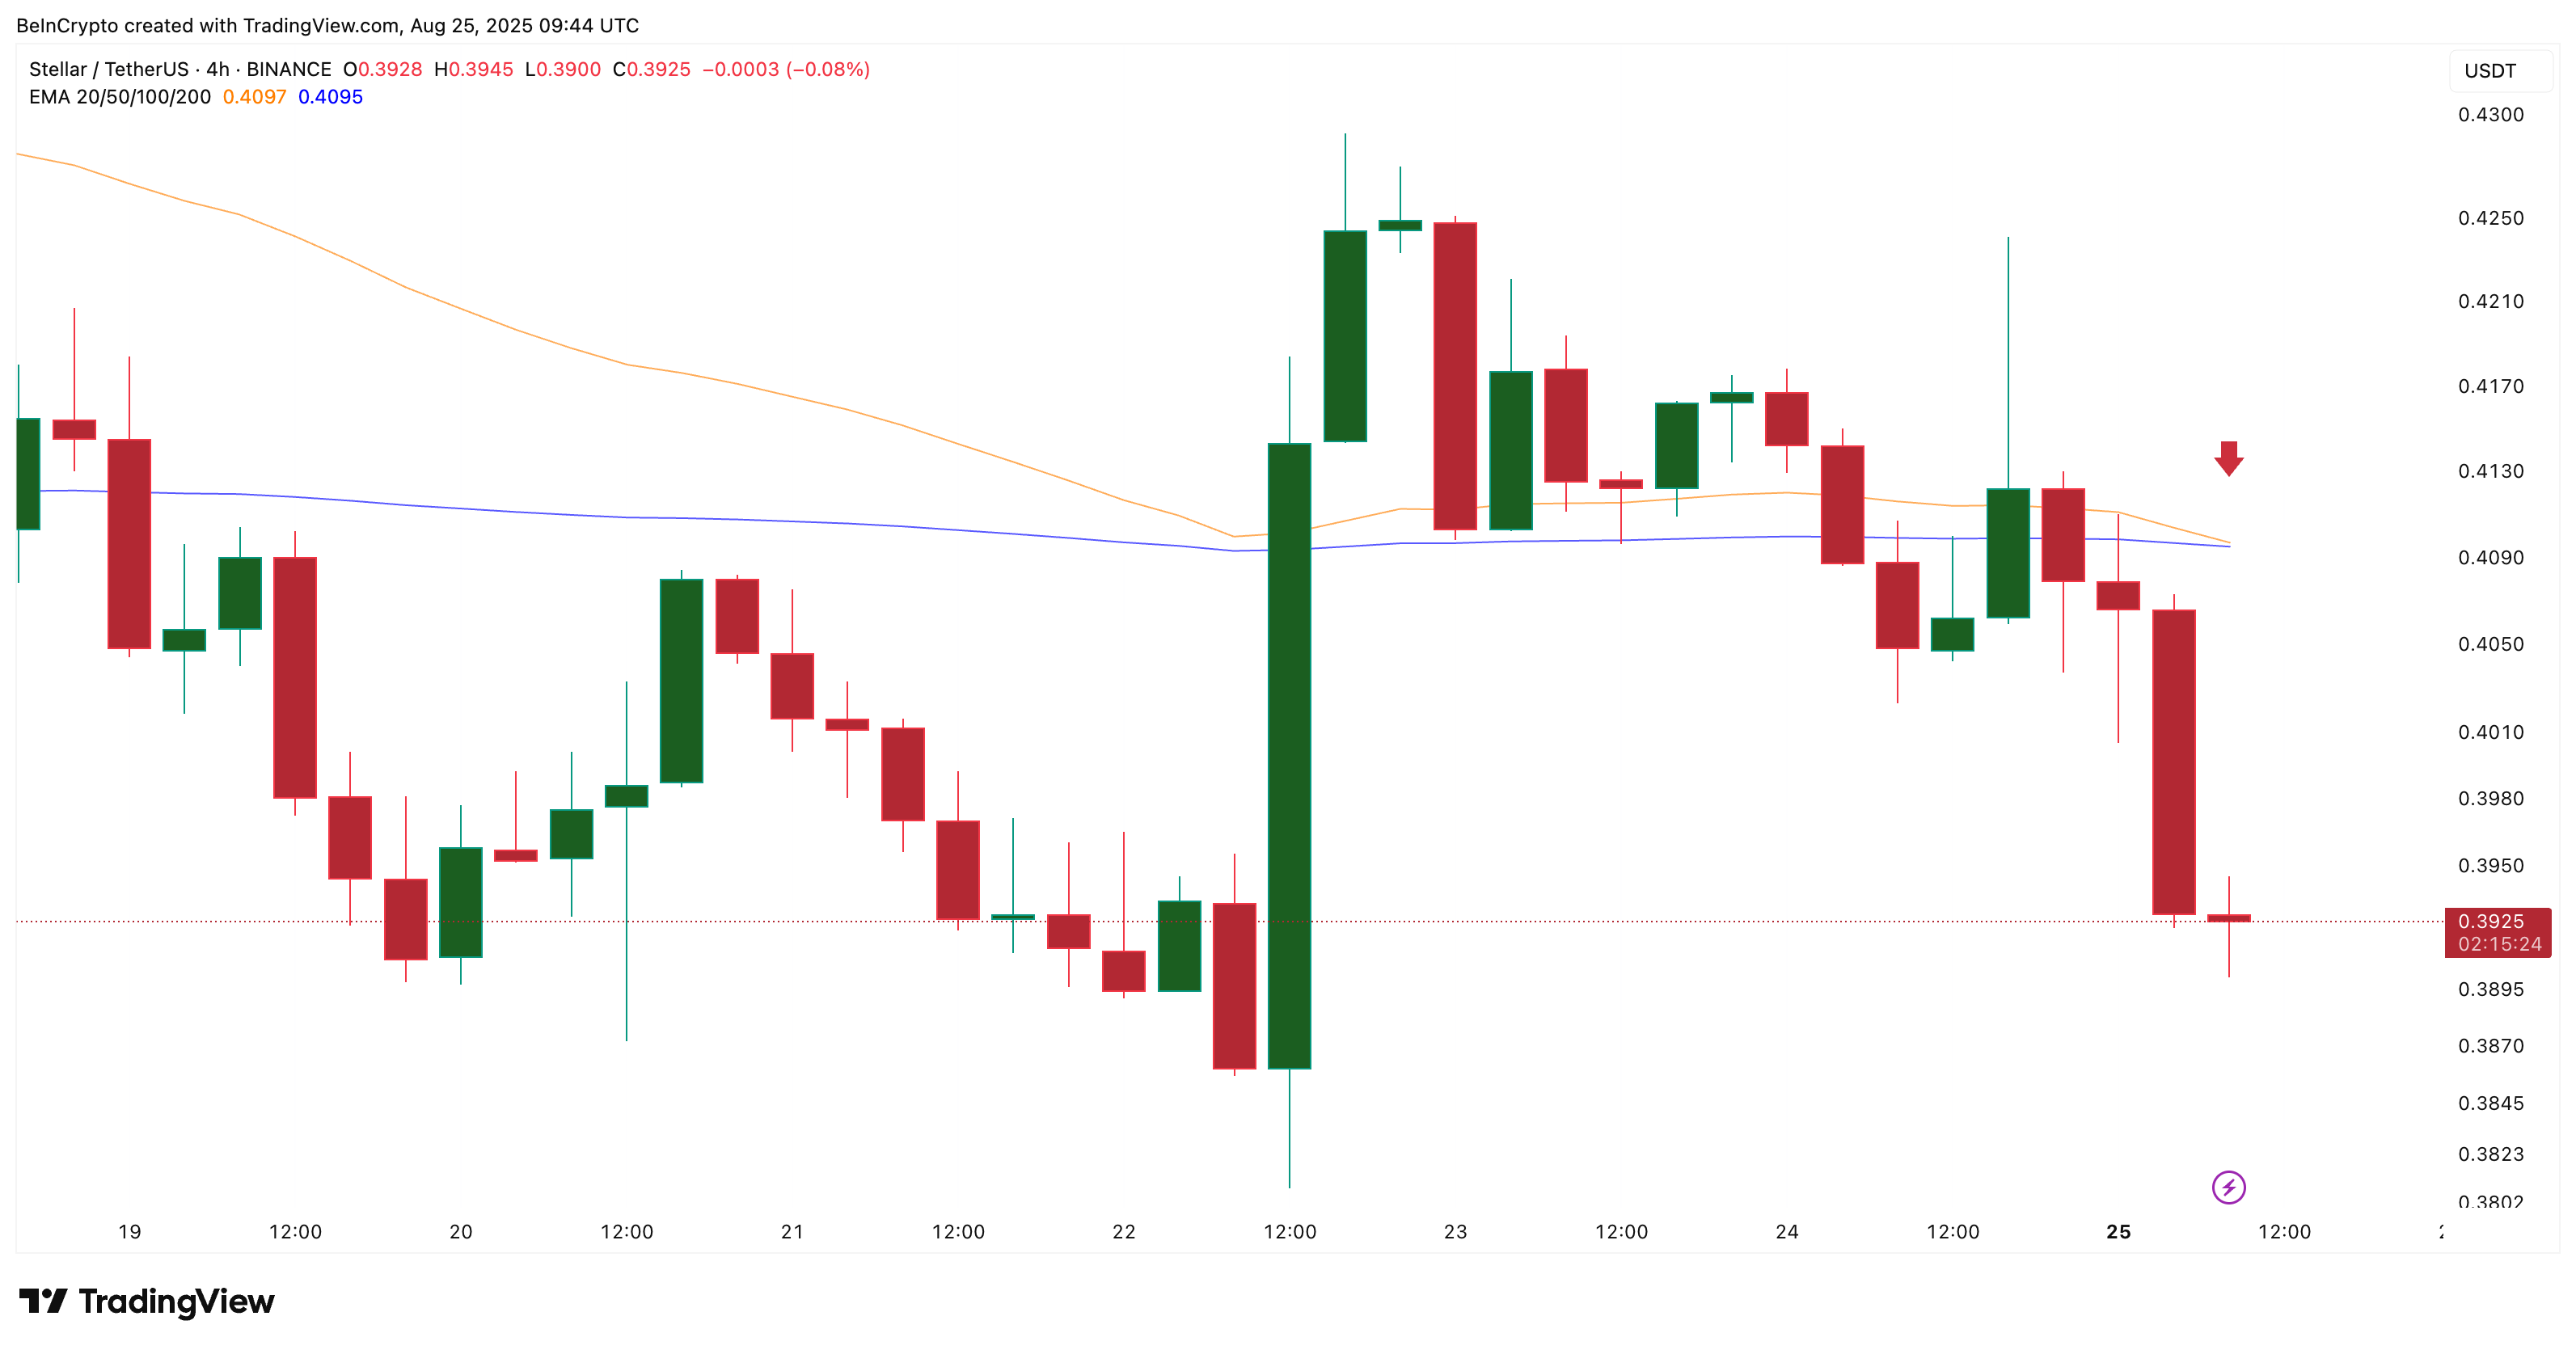 XLM Price And Looming Crossover:
An Exponential Moving Average (EMA) tracks price trends by giving more weight to recent candles. On shorter charts like the 4-hour, traders often watch if the 50 EMA falls below the 200 EMA. This forms a ‘death cross,’ which is seen as bearish because it shows short-term momentum is fading against the longer trend, often leading to sharper drops if support levels fail.
If confirmed, this bearish “Death” crossover would be the technical trigger that validates what social dominance has hinted: that Stellar’s momentum is slipping and deeper losses may be on the horizon. Together, the weakening social chatter and looming crossover create the setup for a heavy downside scenario.
Clustered XLM Price Supports Could Give Way to $0.24
At present, the XLM price trades around $0.39, holding just above thin support at $0.38. If this line breaks, the price could quickly slide to $0.36, and from there, weakness could extend to $0.24.
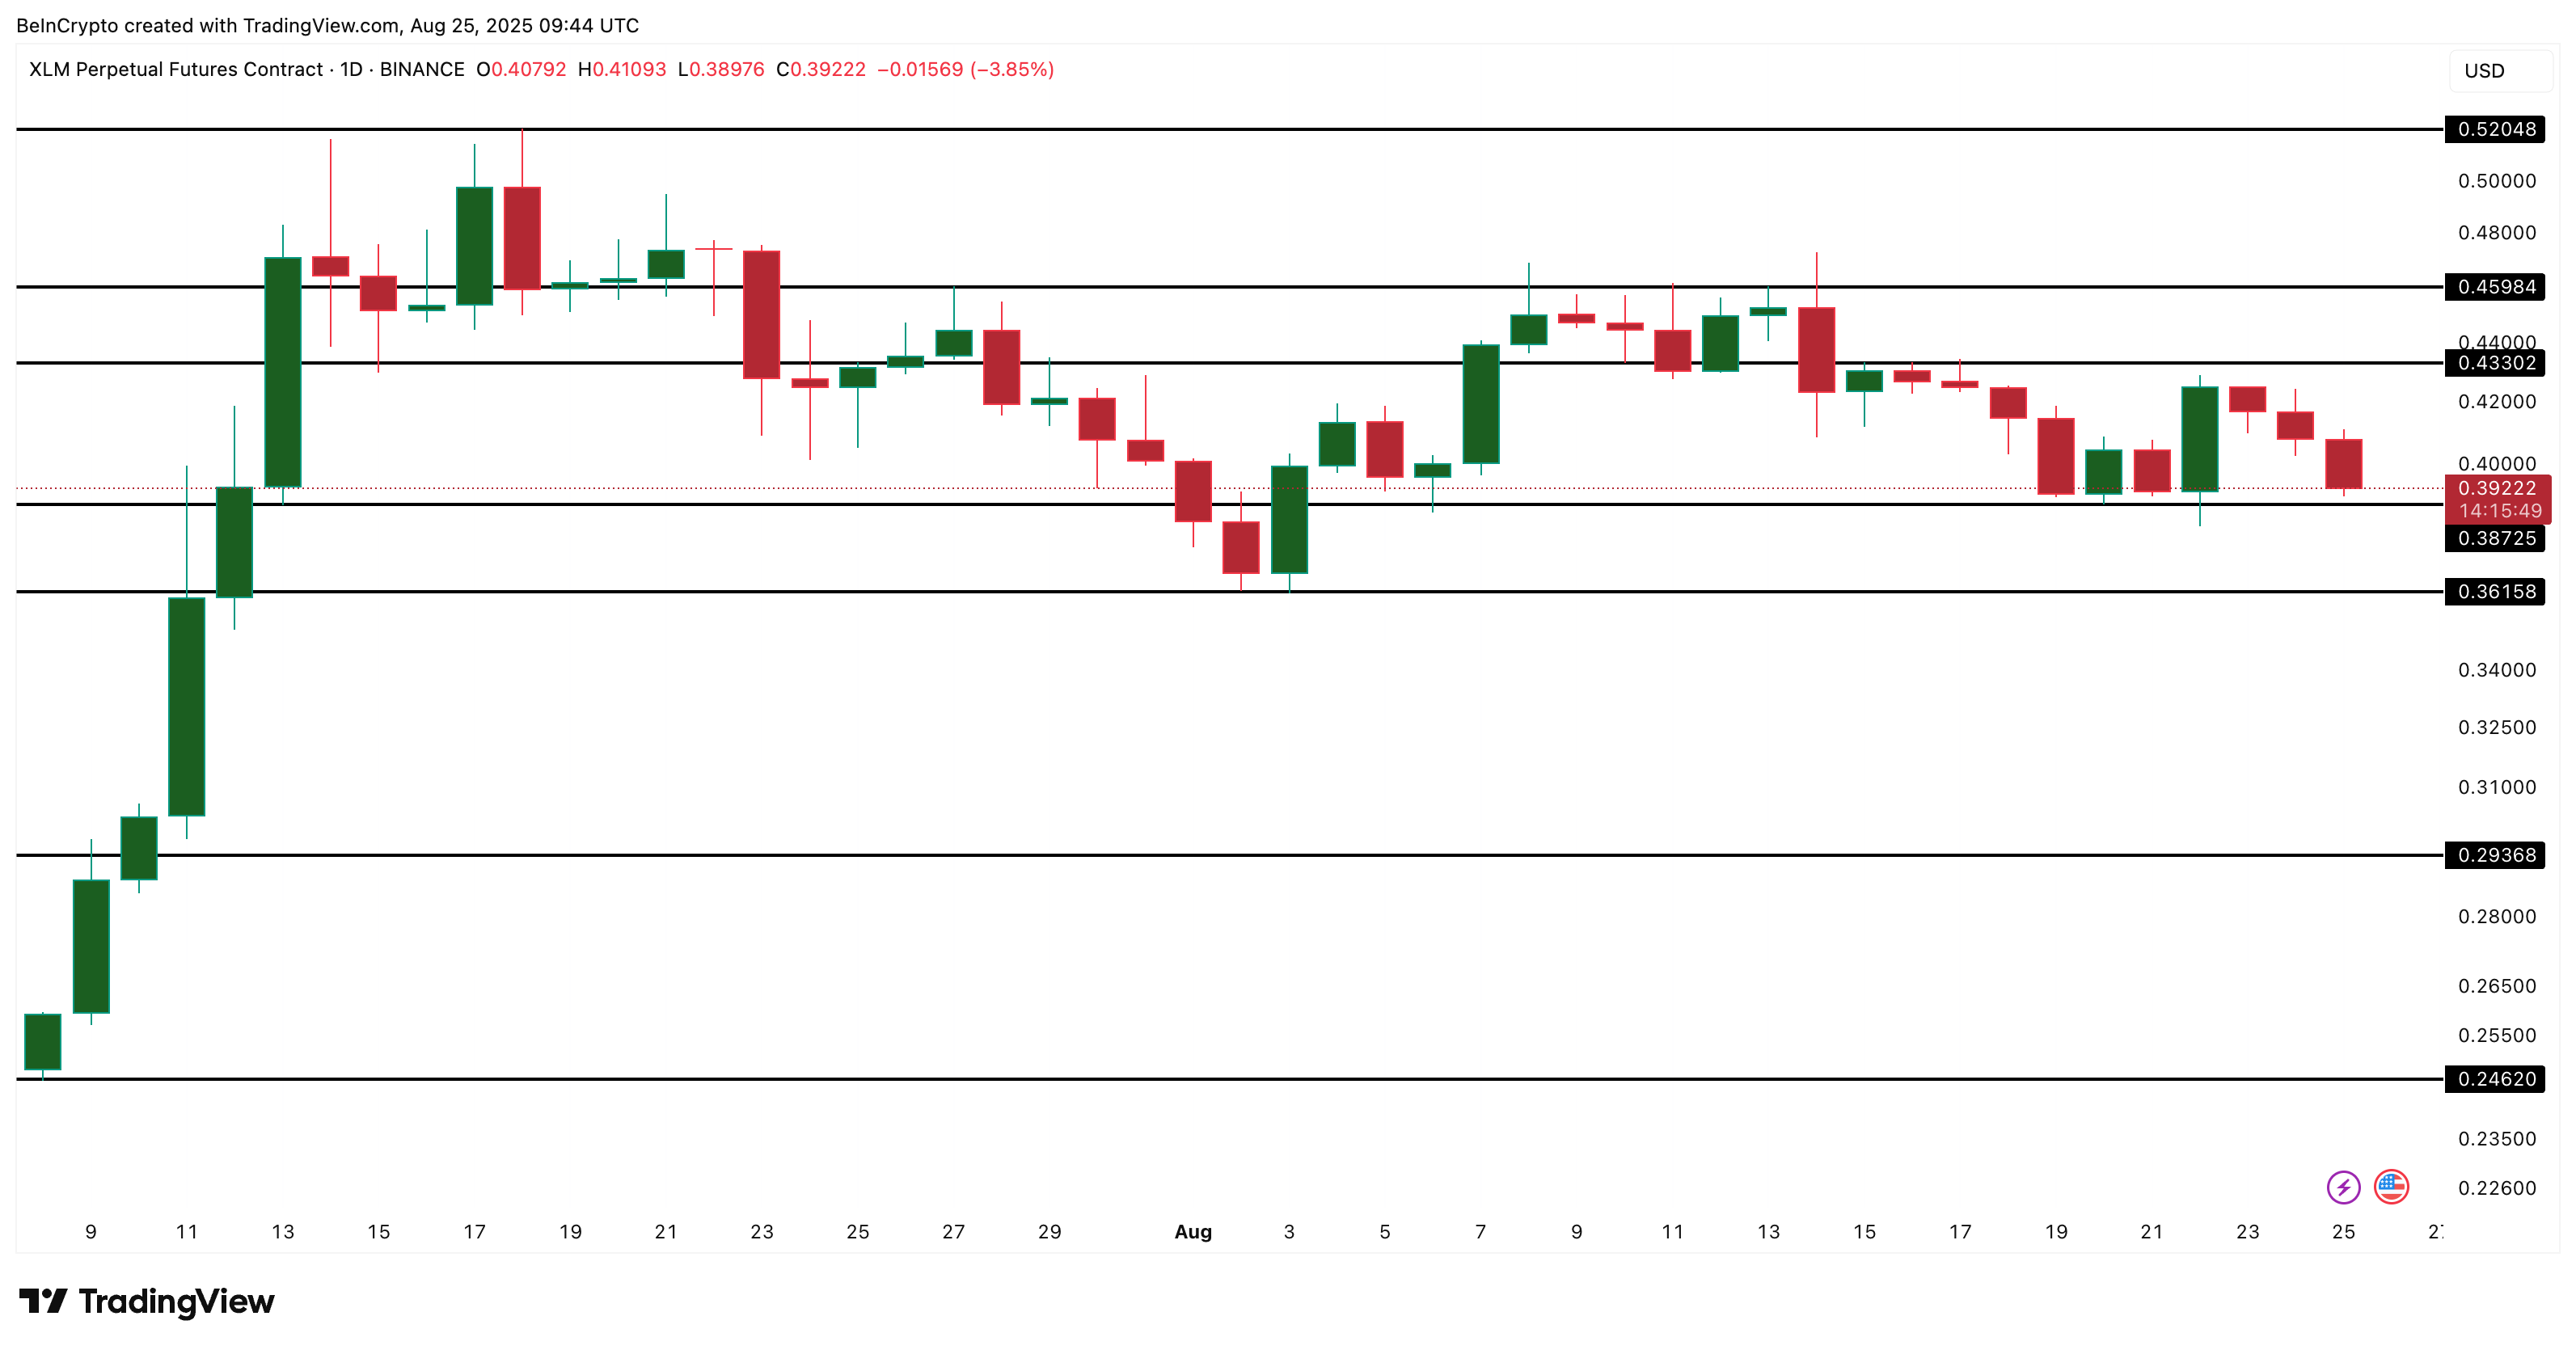 XLM Price Analysis:
That would mark a nearly 40% correction from current levels. The problem for Stellar is that the supports under $0.39 are clustered very close together. When that happens, a sharp move can sweep through multiple levels in one go, leaving the XLM price with little to no cushion until much lower.
For any recovery, bulls would need to retake $0.43–$0.45. Only then could Stellar reclaim the $0.52 high charted earlier. Without this, the downside case dominates, and the bearish crossover, once confirmed, could accelerate losses.
Disclaimer: The content of this article solely reflects the author's opinion and does not represent the platform in any capacity. This article is not intended to serve as a reference for making investment decisions.
You may also like
Cardano Foundation unveils zero-knowledge series as ADA drops 2.8% to $0.1725

How much CPO demand will Nvidia Rubin Ultra generate? Bernstein: Optical value per Pod will increase fivefold
Bernstein believes that the co-packaged optics (CPO) and fiber demand driven by Nvidia's Rubin Ultra architecture will surge significantly, with the optical content per Pod rising from $1 million to $5.4 million. This will propel the size of Nvidia's optical ecosystem market to $46.8 billion by 2028 (a 91% annual increase). Although the industry faces supply bottlenecks with InP substrates, the outlook remains positive. The institution reiterates its “outperform” rating for Lumentum, Coherent, and Ciena.

UBS Q3 implements a two-way strategy with gold options, heavily invests in technology stocks, and builds positions in SK Hynix (SKHY.US)
UBS Group (UBS.US) has submitted its Q3 holdings report (13F) as of September 30, 2026.

SpaceX (SPCX.US) reportedly attempts “de-Nvidiaization” at the rack level: developing Kessel cabinets to bypass L6 compute boards, purchasing only chips
SemiAnalysis: SpaceX has developed its own Kessel cabinet, bypassing Nvidia's L6 cards to provide more options for manufacturing its own hardware.

Crypto prices
More


