
Bitcoin And Crypto Market To Crash? Analyst’s August-September Prediction

According to a new technical analysis, Bitcoin (BTC) and the broader crypto market could be mirroring historical post-halving cycle patterns. While the market has previously rallied through July and August, historical fractals point to a potential crash in September, followed by a push into a cycle peak later in the year.
September Proves Risky For Bitcoin And Crypto Market
A recent X social media post by crypto analyst Benjamin Cowen has highlighted a recurring pattern in Bitcoin’s price action that could have significant implications for the market over the coming months. His analysis shows that Bitcoin has consistently followed a post-halving cycle that exhibits distinct seasonal price movements, particularly around July, August, and September.
The chart shared by Cowen illustrates that in previous cycles, Bitcoin has often rallied in July and August, fueling optimism and strong market sentiment. However, each time this has been followed by a September crash, leading to a reset before the final push toward the cycle top, which usually arrives in the last quarter of the year.
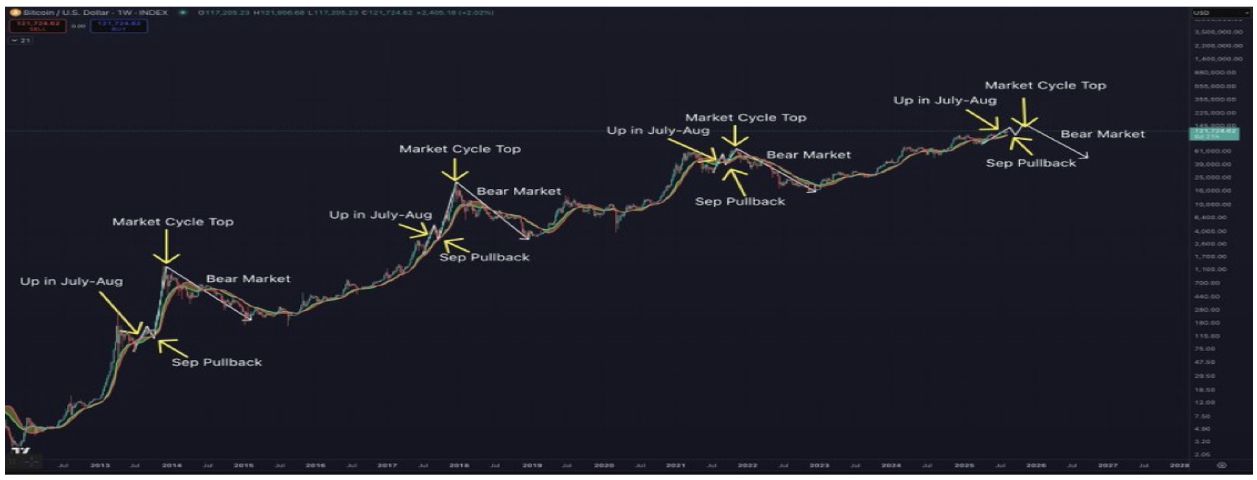
According to the analysis, this repeating structure is not unique to a single cycle but has appeared across multiple past cycles, giving weight to the expert’s argument that history could be repeating. In 2013, 2017, and 2021, Bitcoin’s price behavior followed this pattern almost identically, showing strength in mid-summer and weakness in September.
After a final rally to a peak, each of these cycles was eventually followed by an extended bear market phase, during which valuations corrected sharply from their highs. Based on Cowen’s report, the current cycle appears to be unfolding the same way, as Bitcoin already displayed strength in July and August this year, sparking concerns that a September pullback could be approaching.

BTC Cycles Suggest Market Still Has Room To Grow
A new technical analysis by crypto market expert TechDev also reveals a recurring pattern in Bitcoin’s long-term price cycles, arguing that, contrary to popular belief, the current market may still be far from its peak. The analysis, supported by a historical chart of BTC’s performance, shows that every market top has consistently occurred around 14 months after a specific cyclical signal.
The chart outlines multiple Bitcoin cycles dating back to 2011, with tops and bottoms clearly marked with green and red indicators. Each upward run is followed by a significant correction and then a recovery accumulation phase. The data also revealed that each cycle top often aligned with a measured time frame of approximately 420 days.

Based on this model, current projections show that Bitcoin still has room to run. The most recent green marker on the chart signals that the market could already be transitioning out of its corrective phase. If historical patterns hold, this could mean the market is entering a prolonged growth window rather than nearing exhaustion.
Featured image from Unsplash, chart from TradingView
Disclaimer: The content of this article solely reflects the author's opinion and does not represent the platform in any capacity. This article is not intended to serve as a reference for making investment decisions.
You may also like
How much CPO demand will Nvidia Rubin Ultra generate? Bernstein: Optical value per Pod will increase fivefold
Bernstein believes that the co-packaged optics (CPO) and fiber demand driven by Nvidia's Rubin Ultra architecture will surge significantly, with the optical content per Pod rising from $1 million to $5.4 million. This will propel the size of Nvidia's optical ecosystem market to $46.8 billion by 2028 (a 91% annual increase). Although the industry faces supply bottlenecks with InP substrates, the outlook remains positive. The institution reiterates its “outperform” rating for Lumentum, Coherent, and Ciena.

UBS Q3 implements a two-way strategy with gold options, heavily invests in technology stocks, and builds positions in SK Hynix (SKHY.US)
UBS Group (UBS.US) has submitted its Q3 holdings report (13F) as of September 30, 2026.

SpaceX (SPCX.US) reportedly attempts “de-Nvidiaization” at the rack level: developing Kessel cabinets to bypass L6 compute boards, purchasing only chips
SemiAnalysis: SpaceX has developed its own Kessel cabinet, bypassing Nvidia's L6 cards to provide more options for manufacturing its own hardware.

$3.7 billion “data center power equipment prepayments” abandoned! What did "the most active buyer of gas turbines", SoftBank, see?
In the second quarter of fiscal year 2026, SoftBank reported a net loss of $7.1 billion, primarily due to a $3.7 billion impairment charge from a $9.5 billion advance payment for power generation equipment for US data centers—of which about $2.9 billion was non-refundable and effectively lost. The CFO admitted that SoftBank placed orders before the project plan was finalized, and is now conducting a comprehensive review of its procurement strategy. "The most aggressive purchaser of gas turbines has now written off the deposit in this way."
Crypto prices
More


