
Bitcoin charts are similar to the 2021 top: Will history rhyme?

Bitcoin’s price chart is starting to mimic the pattern it displayed when it reached the previous cycle’s all-time high of $69,000 in November 2021, according to a crypto trader.
Other traders argued that charts don’t tell the full story now, amid mounting demand for Bitcoin from crypto treasury companies.
Bitcoin charts look similar to 2021, trader says
Technical analysts often compare Bitcoin’s price chart to similar patterns in past cycles to figure out when the price might peak, when to sell and when money may start rotating into other assets.
“Has anyone else noticed that the topping price action in 2021 looks exactly the same as current price action?” crypto trader Nebraskangooner said in an X post on Thursday, pointing to a chart showing what appeared to be a double top pattern often viewed by traders as bearish.
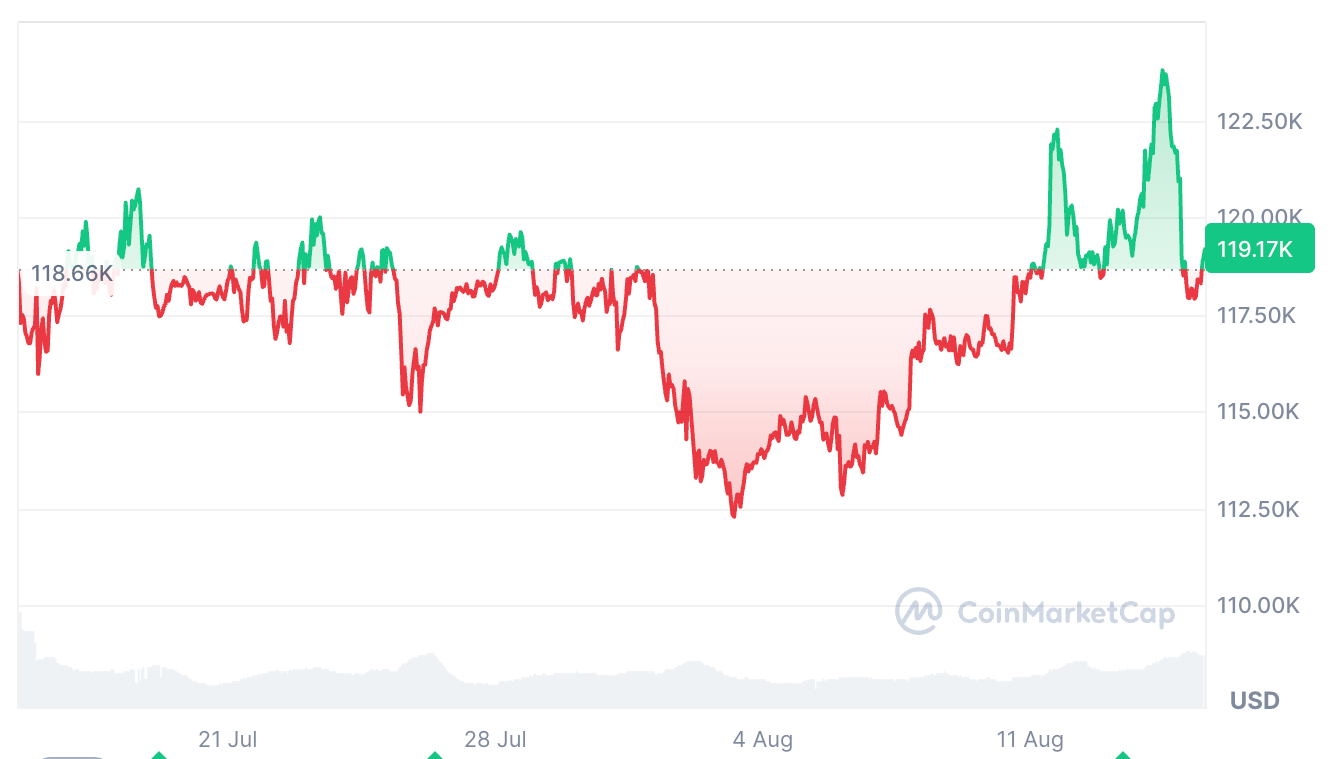 Bitcoin has fallen 4.3% over the past 24 hours, after reaching a new all-time high of $124,100 on Thursday. Source: CoinMarketCap
Crypto analyst Benjamin Cowen agreed, suggesting that the Bitcoin chart tracks the same pattern each post-halving year.
“Up in July-Aug. Down in Sep. Up into the market cycle top in Q4. Bear Market,” he said.
Traders using charts to predict prices are “fooling themselves”
Still, crypto trader Kale Abe said Nebraskangooner’s observation was “another instance where charts and fractals don’t matter.”
“The only thing that matters is the treasury companies and if they are out of ammo or not,” Kale Abe said. BitcoinTreasuries.Net data shows that $150.98 billion worth of Bitcoin has been scooped up by publicly traded Bitcoin treasury companies.
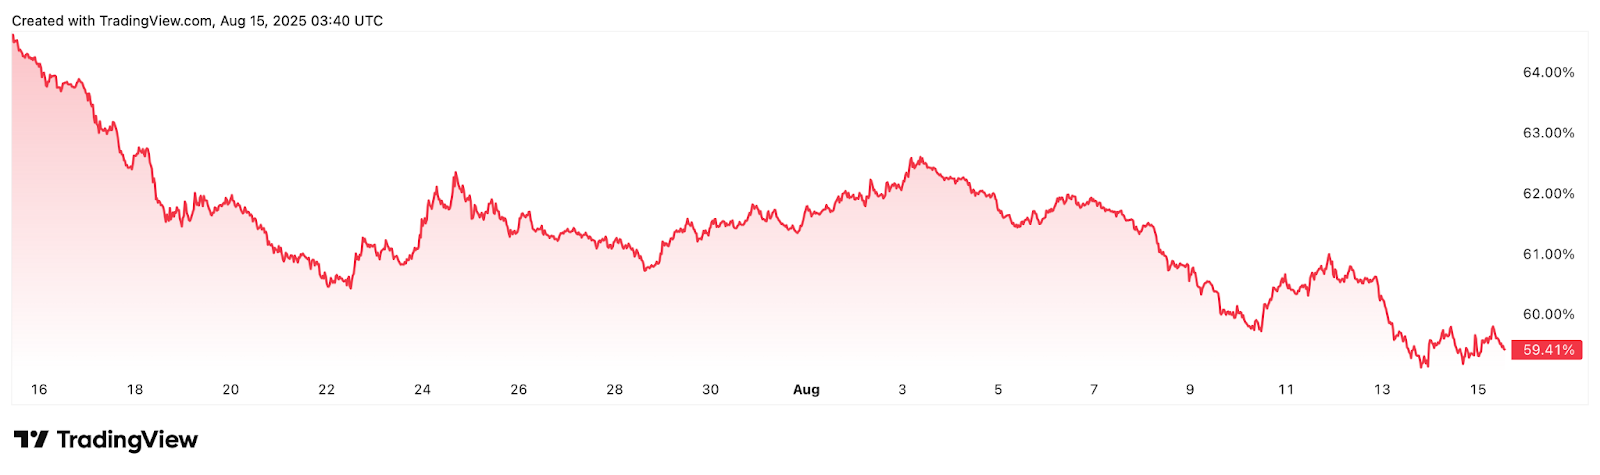 Bitcoin dominance, which measures Bitcoin’s overall market share, fell 6.55% over the past 30 days. Source: TradingView
Abe also doubted that Bitcoin would go “into a bear market” as Ether is nearing its all-time highs. “Impossible,” he said. Ether is up 19% over the past seven days, trading at $4,612, about 5.75% below its 2021 all-time highs of $4,878.
It comes just a few weeks after veteran trader Peter Brandt told Cointelegraph Magazine , “Anyone that looks at the charts and tries to tell you where anything is going is actually just kind of fooling themselves.”
Brandt said the only real use of a price chart is seeing where the price has been and where it is now.
Disclaimer: The content of this article solely reflects the author's opinion and does not represent the platform in any capacity. This article is not intended to serve as a reference for making investment decisions.
You may also like
How much CPO demand will Nvidia Rubin Ultra generate? Bernstein: Optical value per Pod will increase fivefold
Bernstein believes that the co-packaged optics (CPO) and fiber demand driven by Nvidia's Rubin Ultra architecture will surge significantly, with the optical content per Pod rising from $1 million to $5.4 million. This will propel the size of Nvidia's optical ecosystem market to $46.8 billion by 2028 (a 91% annual increase). Although the industry faces supply bottlenecks with InP substrates, the outlook remains positive. The institution reiterates its “outperform” rating for Lumentum, Coherent, and Ciena.

UBS Q3 implements a two-way strategy with gold options, heavily invests in technology stocks, and builds positions in SK Hynix (SKHY.US)
UBS Group (UBS.US) has submitted its Q3 holdings report (13F) as of September 30, 2026.

SpaceX (SPCX.US) reportedly attempts “de-Nvidiaization” at the rack level: developing Kessel cabinets to bypass L6 compute boards, purchasing only chips
SemiAnalysis: SpaceX has developed its own Kessel cabinet, bypassing Nvidia's L6 cards to provide more options for manufacturing its own hardware.

$3.7 billion “data center power equipment prepayments” abandoned! What did "the most active buyer of gas turbines", SoftBank, see?
In the second quarter of fiscal year 2026, SoftBank reported a net loss of $7.1 billion, primarily due to a $3.7 billion impairment charge from a $9.5 billion advance payment for power generation equipment for US data centers—of which about $2.9 billion was non-refundable and effectively lost. The CFO admitted that SoftBank placed orders before the project plan was finalized, and is now conducting a comprehensive review of its procurement strategy. "The most aggressive purchaser of gas turbines has now written off the deposit in this way."
Crypto prices
More


