Bitget App
Trade smarter
Buy cryptoMarketsTradeFuturesStocksEarnInstitutionAI & More
From Bounce to Breakout? Key Signals in FARTCOIN, HYPE, and APT Price Action

From Bounce to Breakout? Key Signals in FARTCOIN, HYPE, and APT Price Action

CryptonewslandCryptonewsland2025/08/13 23:25
By:by Yasmin
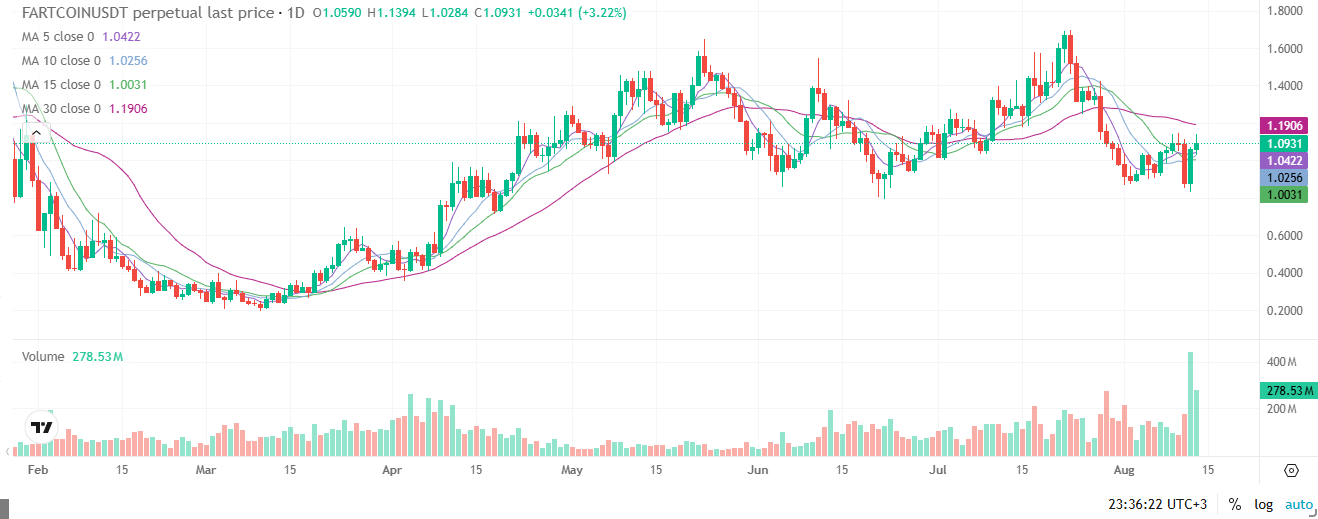
  • FARTCOIN Signals Early Recovery – Price rebounded from $1.00 with a 3.22% daily gain and rising volume, eyeing the $1.12–$1.20 resistance zone.
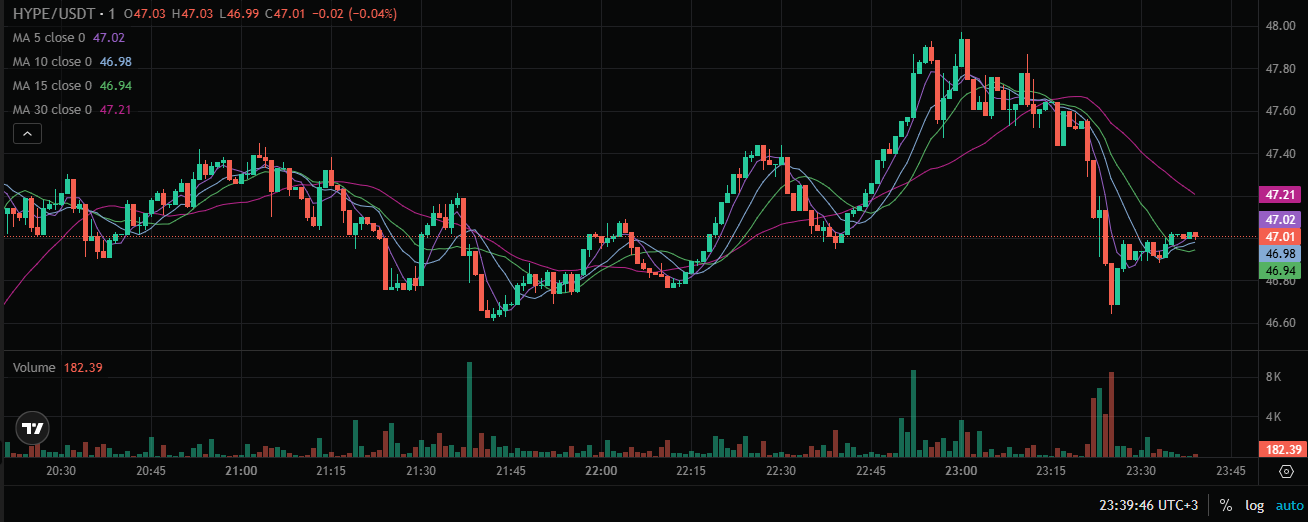
  • HYPE Faces Sharp Intraday Reversal – A strong post-22:15 rally toward $47.80 quickly faded, with selling pressure pulling the price back to near $47.00.
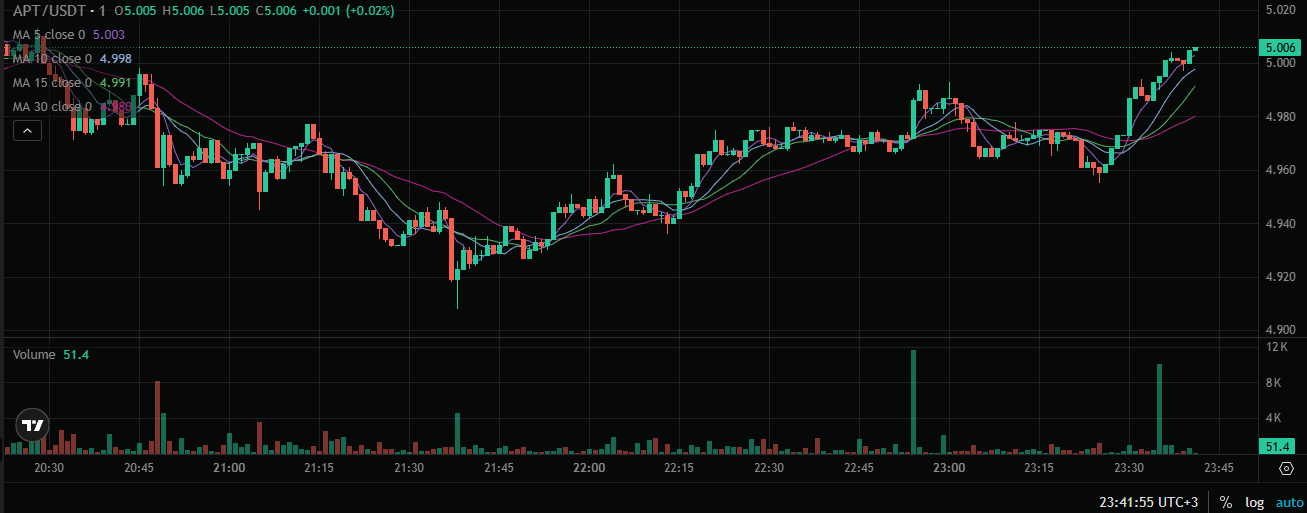
  • APT Closes in Firm Uptrend—Gradual recovery reclaimed the $5.00 level by session end, supported by stronger buying volume and upward-moving averages.

FARTCOIN, HYPE, and APT all showed notable movements across different timeframes, signaling potential shifts in short-term and medium-term market structure. FARTCOIN staged a daily rebound, HYPE displayed sharp intraday swings, and APT ended its session in a firm upward trend. These patterns indicate price action that could set the stage for stronger directional moves if momentum persists.

FARTCOIN Daily Price Action

FARTCOIN rebounded sharply after a recent pullback, climbing from the $1.00 area to around $1.0931 in today’s session. The daily gain of 3.22% came alongside a surge in trading volume to 278.53 million units. Such volume expansion suggests increased participation and possible accumulation.
From Bounce to Breakout? Key Signals in FARTCOIN, HYPE, and APT Price Action image 0 From Bounce to Breakout? Key Signals in FARTCOIN, HYPE, and APT Price Action image 1

Short-term moving averages between $1.0031 and $1.0422 have converged, signaling potential base building under current price levels. The price is holding above these averages, showing underlying support in recent sessions. However, the 30-day moving average at $1.1906 remains as a key resistance level.

Volatility has expanded with longer candle wicks and a noticeable increase in volume.It may be tested by a prolonged press on the region around $1.12 to 1.20. On the other hand a fall below 1.05 may prompt a reconsolidation.

HYPE Intraday Swings

Lastly, HYPE price action was range bound till early into the session between 20:30 and 22:00 and was trading under the $47.00 mark. In the present phase, short-term moving averages happened to be very closely knit because of the low momentum and the lack of directional pressure. Volume remained moderate without clear dominance from buyers or sellers.
From Bounce to Breakout? Key Signals in FARTCOIN, HYPE, and APT Price Action image 2 From Bounce to Breakout? Key Signals in FARTCOIN, HYPE, and APT Price Action image 3

After 22:15, HYPE broke higher, reaching near $47.80 in a swift upward move. The rally coincided with stronger buying volume, suggesting a temporary surge in positive sentiment. However, this advance reversed quickly when selling pressure emerged.

Following the peak, the price dropped sharply toward $46.80 after 23:25. Red volume bars increased, showing intensified exits from positions. The market then stabilized above $47.00 as moving averages flattened.

APT Strong Session Close

APT began its 1-minute chart session with a mild decline from around $5.00 to near $4.94 by 21:30. Volume stayed modest during this early phase, hinting at a lack of aggressive selling. Price behavior shifted as higher lows began to form.
From Bounce to Breakout? Key Signals in FARTCOIN, HYPE, and APT Price Action image 4 From Bounce to Breakout? Key Signals in FARTCOIN, HYPE, and APT Price Action image 5

Momentum picked up after 22:15 as buying strengthened. This resulted in a steady climb that regained the $5.00 level. Short-term moving averages turned upward, supporting the late-session advance.

By the session’s end, APT traded above $5.00 with stronger volume. The final candles showed an established upward bias into the close. This structure suggests potential for continued strength if follow-through emerges in the next trading phase.
0
0

Disclaimer: The content of this article solely reflects the author's opinion and does not represent the platform in any capacity. This article is not intended to serve as a reference for making investment decisions.

Understand the market, then trade.
Bitget offers one-stop trading for cryptocurrencies, stocks, and gold.
Trade now!

You may also like

How much CPO demand will Nvidia Rubin Ultra generate? Bernstein: Optical value per Pod will increase fivefold

Bernstein believes that the co-packaged optics (CPO) and fiber demand driven by Nvidia's Rubin Ultra architecture will surge significantly, with the optical content per Pod rising from $1 million to $5.4 million. This will propel the size of Nvidia's optical ecosystem market to $46.8 billion by 2028 (a 91% annual increase). Although the industry faces supply bottlenecks with InP substrates, the outlook remains positive. The institution reiterates its “outperform” rating for Lumentum, Coherent, and Ciena.

华尔街见闻•2026/11/11 08:47
How much CPO demand will Nvidia Rubin Ultra generate? Bernstein: Optical value per Pod will increase fivefold

UBS Q3 implements a two-way strategy with gold options, heavily invests in technology stocks, and builds positions in SK Hynix (SKHY.US)

UBS Group (UBS.US) has submitted its Q3 holdings report (13F) as of September 30, 2026.

智通财经•2026/11/11 08:22
UBS Q3 implements a two-way strategy with gold options, heavily invests in technology stocks, and builds positions in SK Hynix (SKHY.US)

SpaceX (SPCX.US) reportedly attempts “de-Nvidiaization” at the rack level: developing Kessel cabinets to bypass L6 compute boards, purchasing only chips

SemiAnalysis: SpaceX has developed its own Kessel cabinet, bypassing Nvidia's L6 cards to provide more options for manufacturing its own hardware.

智通财经•2026/11/11 08:20
SpaceX (SPCX.US) reportedly attempts “de-Nvidiaization” at the rack level: developing Kessel cabinets to bypass L6 compute boards, purchasing only chips

$3.7 billion “data center power equipment prepayments” abandoned! What did "the most active buyer of gas turbines", SoftBank, see?

In the second quarter of fiscal year 2026, SoftBank reported a net loss of $7.1 billion, primarily due to a $3.7 billion impairment charge from a $9.5 billion advance payment for power generation equipment for US data centers—of which about $2.9 billion was non-refundable and effectively lost. The CFO admitted that SoftBank placed orders before the project plan was finalized, and is now conducting a comprehensive review of its procurement strategy. "The most aggressive purchaser of gas turbines has now written off the deposit in this way."

华尔街见闻•2026/11/11 08:19