Bitget App
Trade smarter
Buy cryptoMarketsTradeFuturesStocksEarnInstitutionAI & More
LINK Surges 3.6% Above $22 on Rising Volume with Breakout Pattern Forming

LINK Surges 3.6% Above $22 on Rising Volume with Breakout Pattern Forming

CryptonewslandCryptonewsland2025/08/10 19:40
By:by Vee Peninah
  • LINK trades at $22.01, up 3.6% in 24 hours, with support at $21.07 and resistance at $22.58.
  • Trading volume surged 18.84% to $1.61B, aligning with a weekly chart breakout pattern.
  • Market cap reached $14.94B, while FDV stood at $22.02B, both rising alongside price gains.

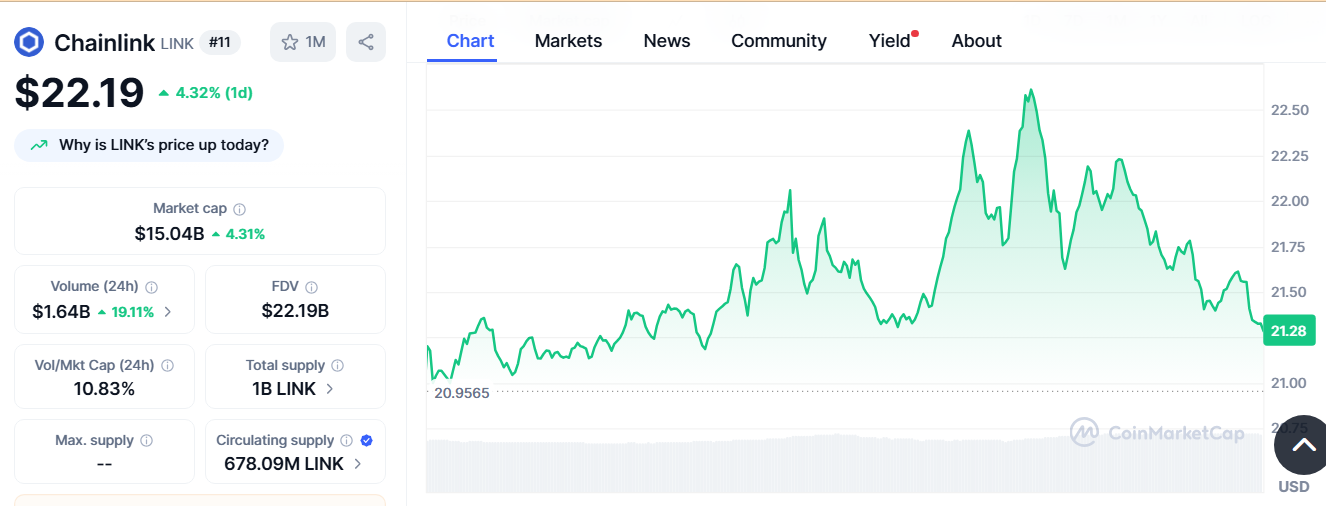
LINK has recorded steady gains over the last 24 hours, trading at $22.01 at the latest market check. This represents a daily increase of 3.6%, supported by stronger market activity. The token has maintained price action above its identified support level at $21.07, while testing resistance at $22.58. 

The 24-hour trading range has remained between these two levels, indicating a contained movement within a narrow band. Market capitalization currently stands at $14.94 billion, reflecting a 3.68% rise over the same period.

LINK Volume Surges as Price Nears Upper Range Boundary

Trading volumes have climbed notably, reaching $1.61 billion over the past 24 hours. This represents an 18.84% increase from the previous day’s total. The increase in trading volume has coincided with price action approaching the upper range boundary. Despite repeated tests, LINK has yet to confirm a breakout beyond the $22.58 resistance level.
LINK Surges 3.6% Above $22 on Rising Volume with Breakout Pattern Forming image 0 LINK Surges 3.6% Above $22 on Rising Volume with Breakout Pattern Forming image 1 Source: CoinMarketCap

The fully diluted valuation (FDV) is currently at $22.02 billion, showing a similar percentage rise to the market capitalization. This parallel growth between FDV and circulating cap reflects the synchronized movement of valuation metrics with the price advance.

LINK Tests Resistance After Breakout From Consolidation

On the weekly timeframe, LINK’s chart displays a breakout pattern forming after an extended consolidation phase. Price action has been shaped by a descending structure, which has now transitioned toward an upward move. This change has placed focus on the $21.07 support level, which has held through recent tests and provided stability during volatile sessions.

Resistance at $22.58 stands as the immediate price ceiling. Previous attempts to move beyond this point were met with selling pressure, which redirected price action back into its consolidation range. Maintaining movement above support while testing resistance remains critical for sustaining upward momentum in the short term.

Chainlink (LINK) Advances as Key Support and Rising Metrics Signal Strength

LINK’s recent 50% price advance over previous weeks places it among notable performers in the large-cap segment. The weekly chart suggests a shift from a prolonged consolidation toward a potential sustained upward trend. Higher trading activity, coupled with the ability to hold above key support, has drawn increased attention to this price zone.

In the current market environment, the parallel rise in price, trading volume, market capitalization, and FDV shows a synchronized upward movement. This alignment of multiple indicators underlines the current trading range’s importance for the asset’s positioning in the broader market structure.


0
0

Disclaimer: The content of this article solely reflects the author's opinion and does not represent the platform in any capacity. This article is not intended to serve as a reference for making investment decisions.

Understand the market, then trade.
Bitget offers one-stop trading for cryptocurrencies, stocks, and gold.
Trade now!

You may also like

How much CPO demand will Nvidia Rubin Ultra generate? Bernstein: Optical value per Pod will increase fivefold

Bernstein believes that the co-packaged optics (CPO) and fiber demand driven by Nvidia's Rubin Ultra architecture will surge significantly, with the optical content per Pod rising from $1 million to $5.4 million. This will propel the size of Nvidia's optical ecosystem market to $46.8 billion by 2028 (a 91% annual increase). Although the industry faces supply bottlenecks with InP substrates, the outlook remains positive. The institution reiterates its “outperform” rating for Lumentum, Coherent, and Ciena.

华尔街见闻•2026/11/11 08:47
How much CPO demand will Nvidia Rubin Ultra generate? Bernstein: Optical value per Pod will increase fivefold

UBS Q3 implements a two-way strategy with gold options, heavily invests in technology stocks, and builds positions in SK Hynix (SKHY.US)

UBS Group (UBS.US) has submitted its Q3 holdings report (13F) as of September 30, 2026.

智通财经•2026/11/11 08:22
UBS Q3 implements a two-way strategy with gold options, heavily invests in technology stocks, and builds positions in SK Hynix (SKHY.US)

SpaceX (SPCX.US) reportedly attempts “de-Nvidiaization” at the rack level: developing Kessel cabinets to bypass L6 compute boards, purchasing only chips

SemiAnalysis: SpaceX has developed its own Kessel cabinet, bypassing Nvidia's L6 cards to provide more options for manufacturing its own hardware.

智通财经•2026/11/11 08:20
SpaceX (SPCX.US) reportedly attempts “de-Nvidiaization” at the rack level: developing Kessel cabinets to bypass L6 compute boards, purchasing only chips

$3.7 billion “data center power equipment prepayments” abandoned! What did "the most active buyer of gas turbines", SoftBank, see?

In the second quarter of fiscal year 2026, SoftBank reported a net loss of $7.1 billion, primarily due to a $3.7 billion impairment charge from a $9.5 billion advance payment for power generation equipment for US data centers—of which about $2.9 billion was non-refundable and effectively lost. The CFO admitted that SoftBank placed orders before the project plan was finalized, and is now conducting a comprehensive review of its procurement strategy. "The most aggressive purchaser of gas turbines has now written off the deposit in this way."

华尔街见闻•2026/11/11 08:19
