Bitget App
Trade smarter
Buy cryptoMarketsTradeFuturesStocksEarnInstitutionAI & More
Sui (SUI) Soars Higher While Tracing a Familiar Pattern – What Could Come Next?

Sui (SUI) Soars Higher While Tracing a Familiar Pattern – What Could Come Next?

CoinsProbeCoinsProbe2025/08/08 08:25
By:Nilesh Hembade

Date: Fri, Aug 08, 2025 | 07:56 AM GMT

The cryptocurrency market is flashing bullish signals as Ethereum (ETH) reclaims the $3,900 mark for the first time since late 2024. This 6% daily jump has sparked a broader rally, lifting several major altcoins — including Sui (SUI).

SUI has turned green with an impressive 9% daily jump, extending its monthly gains to over 31%. However, its current chart structure reveals a familiar price behavior, which may offer clues about its next move.

Sui (SUI) Soars Higher While Tracing a Familiar Pattern – What Could Come Next? image 0 Source: Coinmarketcap

Familiar Pattern Hints at Potential Pullback

On the daily timeframe, SUI appears to be trading within a rising wedge — a pattern often associated with slowing bullish momentum and potential reversals.

Looking at the chart, we see a repetitive fractal pattern forming. In the previous cycle, SUI rallied after making a bullish moving average crossover (marked by the blue circle), pushing the price to the upper wedge resistance. However, this was followed by a breakdown below the 25-day MA (marked in red), leading to a sharp drop to the 100-day MA (green circle). From there, SUI found temporary support before dropping further to the lower wedge trendline — registering a correction of roughly 34%.
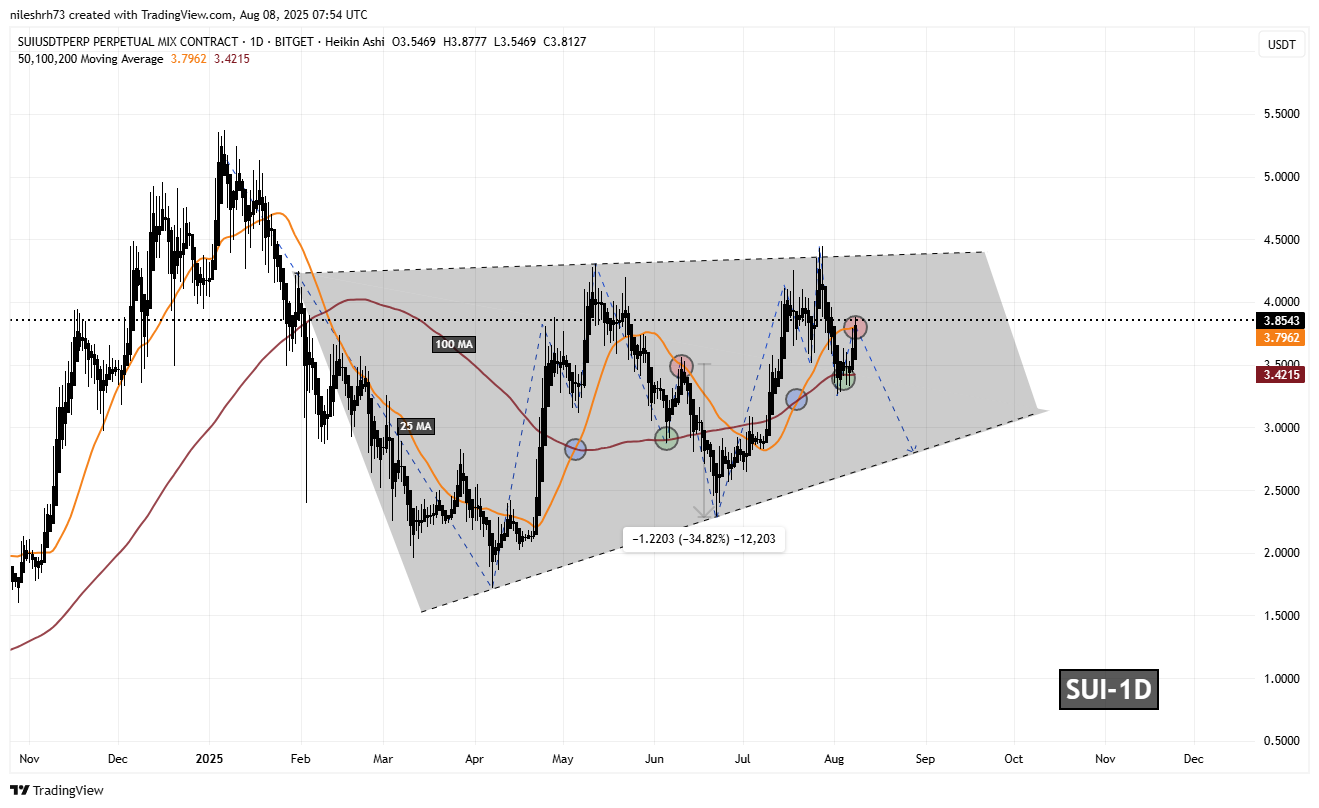
Sui (SUI) Soars Higher While Tracing a Familiar Pattern – What Could Come Next? image 1 Sui (SUI) Daily Chart/Coinsprobe (Source: Tradingview)

Fast forward to the present, and SUI seems to be repeating the same structure.

It recently bounced off the 100-day MA and has now reclaimed the 25-day MA — once again marked by a red circle, placing the asset in a similar position to its last breakdown.

What’s Next for SUI?

If this fractal pattern continues to unfold, a breakdown below the 25-day MA support at $3.79 would act as confirmation. This would open the door for a drop toward the 100-day MA at $3.42, and possibly a further decline toward the wedge’s lower trendline near $2.80 — representing a 26% drop from current levels.

However, if bulls manage to hold the 25-day MA, this would invalidate the bearish scenario and signal strength. In this case, SUI could climb higher, potentially retesting the upper resistance of the wedge around $4.40.

Final Thoughts

SUI is at a critical juncture, mirroring past price action with uncanny accuracy. Whether it repeats its prior drop or breaks out of the pattern will depend on how it reacts around the 25-day moving average. Traders should closely monitor these technical levels in the coming days.


0
0

Disclaimer: The content of this article solely reflects the author's opinion and does not represent the platform in any capacity. This article is not intended to serve as a reference for making investment decisions.

Understand the market, then trade.
Bitget offers one-stop trading for cryptocurrencies, stocks, and gold.
Trade now!

You may also like

How much CPO demand will Nvidia Rubin Ultra generate? Bernstein: Optical value per Pod will increase fivefold

Bernstein believes that the co-packaged optics (CPO) and fiber demand driven by Nvidia's Rubin Ultra architecture will surge significantly, with the optical content per Pod rising from $1 million to $5.4 million. This will propel the size of Nvidia's optical ecosystem market to $46.8 billion by 2028 (a 91% annual increase). Although the industry faces supply bottlenecks with InP substrates, the outlook remains positive. The institution reiterates its “outperform” rating for Lumentum, Coherent, and Ciena.

华尔街见闻•2026/11/11 08:47
How much CPO demand will Nvidia Rubin Ultra generate? Bernstein: Optical value per Pod will increase fivefold

UBS Q3 implements a two-way strategy with gold options, heavily invests in technology stocks, and builds positions in SK Hynix (SKHY.US)

UBS Group (UBS.US) has submitted its Q3 holdings report (13F) as of September 30, 2026.

智通财经•2026/11/11 08:22
UBS Q3 implements a two-way strategy with gold options, heavily invests in technology stocks, and builds positions in SK Hynix (SKHY.US)

SpaceX (SPCX.US) reportedly attempts “de-Nvidiaization” at the rack level: developing Kessel cabinets to bypass L6 compute boards, purchasing only chips

SemiAnalysis: SpaceX has developed its own Kessel cabinet, bypassing Nvidia's L6 cards to provide more options for manufacturing its own hardware.

智通财经•2026/11/11 08:20
SpaceX (SPCX.US) reportedly attempts “de-Nvidiaization” at the rack level: developing Kessel cabinets to bypass L6 compute boards, purchasing only chips

$3.7 billion “data center power equipment prepayments” abandoned! What did "the most active buyer of gas turbines", SoftBank, see?

In the second quarter of fiscal year 2026, SoftBank reported a net loss of $7.1 billion, primarily due to a $3.7 billion impairment charge from a $9.5 billion advance payment for power generation equipment for US data centers—of which about $2.9 billion was non-refundable and effectively lost. The CFO admitted that SoftBank placed orders before the project plan was finalized, and is now conducting a comprehensive review of its procurement strategy. "The most aggressive purchaser of gas turbines has now written off the deposit in this way."

华尔街见闻•2026/11/11 08:19
