Bitget App
Trade smarter
Buy cryptoMarketsTradeFuturesStocksEarnInstitutionAI & More
OMNI Just Broke Out, 25% Pump After 7x Volume Spike

OMNI Just Broke Out, 25% Pump After 7x Volume Spike

CoinspeakerCoinspeaker2025/08/06 16:00
By:By Parth Dubey Editor Hamza Tariq

Omni Network (OMNI) has surged 25% in a sharp breakout from a long-term downtrend, driven by a 770% spike in trading volume.

Key Notes

  • OMNI surged 25% in 24 hours following a 770% increase in trading volume.
  • The token broke out of a long-term descending wedge, signaling trend reversal.
  • Despite the rally, OMNI struggles to hold above the key $5 support level.

Omni Network OMNI $4.87 24h volatility: 23.5% Market cap: $190.05 M Vol. 24h: $408.82 M shot up 25% in the past 24 hours following a massive 770% increase in trading volume. The token reached an intraday high of $5.35 before retreating to $4.83 at the time of writing.

The sudden jump provides a much-needed relief to investors following recent struggles as OMNI remains 83.9% below its all-time high of $29.93.

OMNI hit rock bottom just a month ago, touching a historic low of $1.37. Since then, the asset has shown strong signs of recovery.

However, the token has not yet managed to hold above the $5 mark, a solid support level if sustained .

Wedge Breakout Triggered OMNI Rally

A key factor behind OMNI’s explosive move appears to be a clear breakout from a long-standing descending wedge pattern. The formation, visible on the daily chart, had been containing the token’s price since early April.

$OMNI broke the falling wedge.

Retest holding strong.

Next leg could send it +270%.

Momentum’s real. pic.twitter.com/SRXhFoHft2

— Smith (@CryptoSmith0x) August 7, 2025


The wedge’s narrowing structure signaled decreasing volatility, but the eventual breakout to the upside confirmed a potential shift in trend.

The breakout followed an expansion in the Bollinger Bands, indicating rising volatility. The price climbed above the 20-day simple moving average, which often acts as a short-term trend guide, reinforcing the strength of the breakout.

OMNI Price Analysis: Momentum Is Building

The MACD has made a bullish crossover, suggesting a potential beginning of a new uptrend. However, the histogram remains relatively flat, indicating that the strength of this trend has not yet matured.

The RSI currently stands at 67.5, just below the overbought threshold and the BoP indicator also currently favors buyers.

However, the CMF remains in negative territory at -0.20, suggesting that capital inflows have not yet fully supported the price rise.
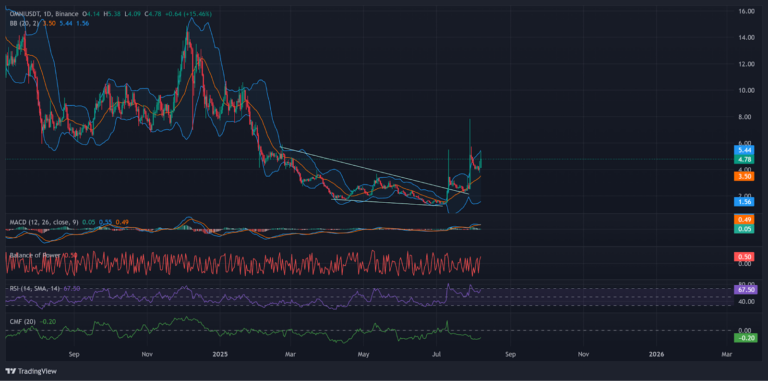
OMNI Just Broke Out, 25% Pump After 7x Volume Spike image 0

OMNI daily chart with momentum indicators. | Source: TradingView

If OMNI is able to turn $5 into support, the next resistance is located around $5.44, which is aligned with the upper Bollinger Band.

A break above this zone might allow OMNI to approach the $6.30 to $6.50 range, where previous price action encountered selling pressure in late 2024. If momentum continues, a move toward $8 could also come into play.

On the other hand, if OMNI drops below the $4 to $3.50 zone, the bullish structure could weaken. In that case, support would be near the 20-day moving average, followed by the lower boundary of the wedge, around $2.90.

A further breakdown could drive prices toward the $2 region, potentially placing OMNI at risk of retesting its all-time low.


0
0

Disclaimer: The content of this article solely reflects the author's opinion and does not represent the platform in any capacity. This article is not intended to serve as a reference for making investment decisions.

Understand the market, then trade.
Bitget offers one-stop trading for cryptocurrencies, stocks, and gold.
Trade now!

You may also like

How much CPO demand will Nvidia Rubin Ultra generate? Bernstein: Optical value per Pod will increase fivefold

Bernstein believes that the co-packaged optics (CPO) and fiber demand driven by Nvidia's Rubin Ultra architecture will surge significantly, with the optical content per Pod rising from $1 million to $5.4 million. This will propel the size of Nvidia's optical ecosystem market to $46.8 billion by 2028 (a 91% annual increase). Although the industry faces supply bottlenecks with InP substrates, the outlook remains positive. The institution reiterates its “outperform” rating for Lumentum, Coherent, and Ciena.

华尔街见闻•2026/11/11 08:47
How much CPO demand will Nvidia Rubin Ultra generate? Bernstein: Optical value per Pod will increase fivefold

UBS Q3 implements a two-way strategy with gold options, heavily invests in technology stocks, and builds positions in SK Hynix (SKHY.US)

UBS Group (UBS.US) has submitted its Q3 holdings report (13F) as of September 30, 2026.

智通财经•2026/11/11 08:22
UBS Q3 implements a two-way strategy with gold options, heavily invests in technology stocks, and builds positions in SK Hynix (SKHY.US)

SpaceX (SPCX.US) reportedly attempts “de-Nvidiaization” at the rack level: developing Kessel cabinets to bypass L6 compute boards, purchasing only chips

SemiAnalysis: SpaceX has developed its own Kessel cabinet, bypassing Nvidia's L6 cards to provide more options for manufacturing its own hardware.

智通财经•2026/11/11 08:20
SpaceX (SPCX.US) reportedly attempts “de-Nvidiaization” at the rack level: developing Kessel cabinets to bypass L6 compute boards, purchasing only chips

$3.7 billion “data center power equipment prepayments” abandoned! What did "the most active buyer of gas turbines", SoftBank, see?

In the second quarter of fiscal year 2026, SoftBank reported a net loss of $7.1 billion, primarily due to a $3.7 billion impairment charge from a $9.5 billion advance payment for power generation equipment for US data centers—of which about $2.9 billion was non-refundable and effectively lost. The CFO admitted that SoftBank placed orders before the project plan was finalized, and is now conducting a comprehensive review of its procurement strategy. "The most aggressive purchaser of gas turbines has now written off the deposit in this way."

华尔街见闻•2026/11/11 08:19
