
Solana Faces Resistance Near $171 as Indicators Reflect Weakening Momentum

- SOL faces rejection near $171, fails to break key resistance, and falls back to $163.
- RSI at 44.72 and MACD crossover confirm weakening momentum and bearish divergence.
- Trading volume up 23.37%, but price remains under pressure near interim support at $160.
Solana (SOL) is showing signs of declining bullish strength, following an intraday pullback near $171 and a continued failure to break long-standing resistance levels. As of press time, SOL was trading at $163.98, marking a 3.29% drop in the past 24 hours. Despite a gain of over $171 during the session, the asset reversed due to increased trading activity, returning to its earlier range.
Chart data from early 2024 through August 2025 shows a continuing horizontal trading range for SOL. The token has repeatedly encountered resistance between $210 and $220, while support has held around the $130 level. A temporary breakout above $300 occurred in December 2024, but the price quickly retraced, reversing the move and reentering the range.
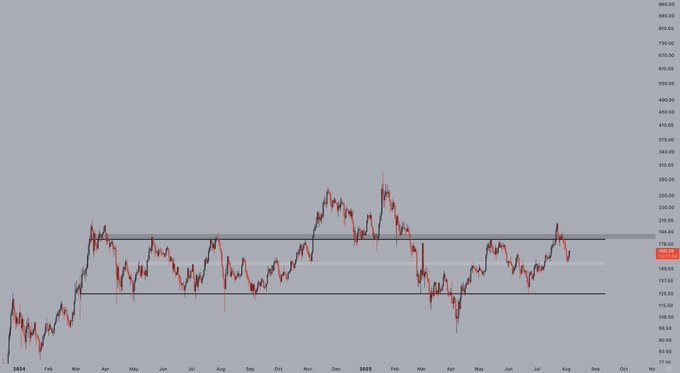
In early 2025, SOL dropped toward the $115–$130 support zone before rebounding in March. Attempts to climb back toward resistance continued through June and July but again failed to breach the $210 mark. The recent decline has returned the token to an interim support area between $160 and $170.
Intraday Spike Rejected Despite Volume Surge
SOL traded above $171 on August 5 following a rally that began the previous evening. The move peaked midday, but strong bearish pressure during the U.S. trading session led to a reversal. CoinMarketCap data shows the price fell back to $164.32 by press time, reflecting a 1.14% intraday decline.
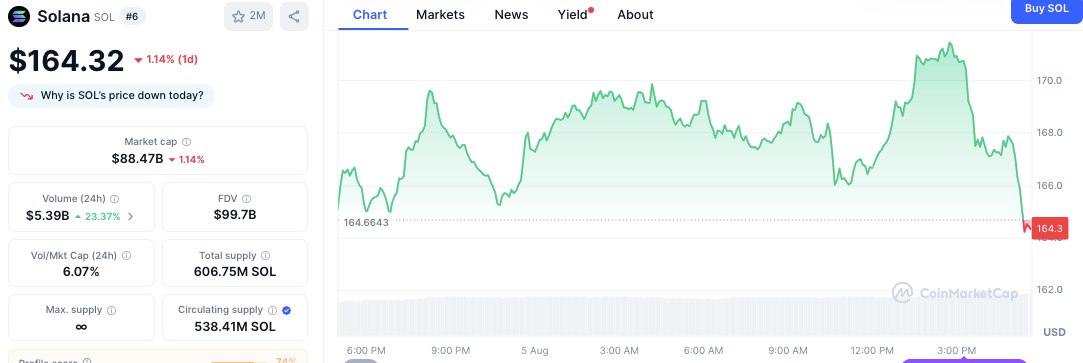
Despite the price drop, trading volume rose. The 24-hour volume climbed 23.37% to $5.39 billion. Solana’s market capitalization currently stands at $88.47 billion, with a total supply of 606.75 million tokens and a circulating supply of 538.41 million. The platform’s Fully Diluted Valuation (FDV) is recorded at $99.78 billion.
RSI and MACD Show Bearish Divergence
Leading technical indicators continue to signal caution. The Relative Strength Index (RSI) has dropped to 44.72, falling below the neutral midpoint of 50. This decline follows a recent peak of around 75 in mid-July, which marked an overbought condition before the latest pullback began.
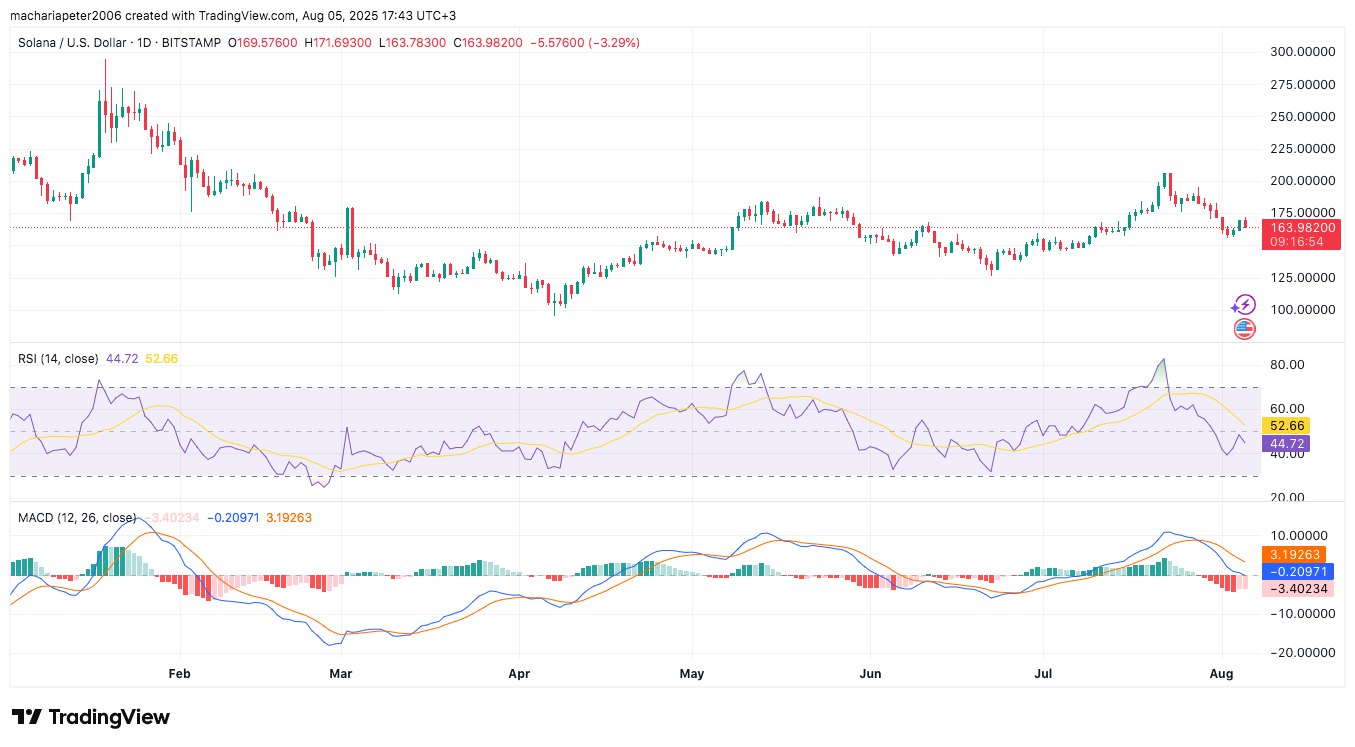
Meanwhile, the Moving Average Convergence Divergence (MACD) also signals bearish momentum. The MACD line is at -0.20971, while the signal line stands at 3.19263, forming a negative crossover. The histogram has turned negative, measured at -3.40234, indicating growing downside momentum.
Until the RSI passes over the 50 mark and the MACD histogram starts to transition to green, SOL could experience more downward pressure. Any decline below $160 would open the token to a bearish support at around $150 and any upward progress would demand a strict retest and sustain above $170.
Disclaimer: The content of this article solely reflects the author's opinion and does not represent the platform in any capacity. This article is not intended to serve as a reference for making investment decisions.
You may also like
How much CPO demand will Nvidia Rubin Ultra generate? Bernstein: Optical value per Pod will increase fivefold
Bernstein believes that the co-packaged optics (CPO) and fiber demand driven by Nvidia's Rubin Ultra architecture will surge significantly, with the optical content per Pod rising from $1 million to $5.4 million. This will propel the size of Nvidia's optical ecosystem market to $46.8 billion by 2028 (a 91% annual increase). Although the industry faces supply bottlenecks with InP substrates, the outlook remains positive. The institution reiterates its “outperform” rating for Lumentum, Coherent, and Ciena.

UBS Q3 implements a two-way strategy with gold options, heavily invests in technology stocks, and builds positions in SK Hynix (SKHY.US)
UBS Group (UBS.US) has submitted its Q3 holdings report (13F) as of September 30, 2026.

SpaceX (SPCX.US) reportedly attempts “de-Nvidiaization” at the rack level: developing Kessel cabinets to bypass L6 compute boards, purchasing only chips
SemiAnalysis: SpaceX has developed its own Kessel cabinet, bypassing Nvidia's L6 cards to provide more options for manufacturing its own hardware.

$3.7 billion “data center power equipment prepayments” abandoned! What did "the most active buyer of gas turbines", SoftBank, see?
In the second quarter of fiscal year 2026, SoftBank reported a net loss of $7.1 billion, primarily due to a $3.7 billion impairment charge from a $9.5 billion advance payment for power generation equipment for US data centers—of which about $2.9 billion was non-refundable and effectively lost. The CFO admitted that SoftBank placed orders before the project plan was finalized, and is now conducting a comprehensive review of its procurement strategy. "The most aggressive purchaser of gas turbines has now written off the deposit in this way."
Crypto prices
More


