
Ethereum (ETH) Price Prediction for August 6

After reclaiming the $3,600 level in a sharp two-day recovery, the Ethereum price today is holding near $3,634.40. The rebound, however, stalled near $3,720, where ETH encountered both Bollinger Band resistance and the 20 EMA cap. With on-chain outflows mounting and intraday momentum softening, traders are watching closely to see whether ETH can hold the $3,590 to $3,624 support zone.
Ethereum Price Forecast Table: August 6, 2025
| Indicator / Zone | Level / Signal |
| Ethereum price today | $3,634.40 |
| Resistance 1 | $3,720 (Bollinger upper band) |
| Resistance 2 | $3,850 (supply zone) |
| Support 1 | $3,624 (50 EMA) |
| Support 2 | $3,576 (100 EMA) |
| Support 3 | $3,360 (200 EMA) |
| RSI (30-min) | 43.73 (bearish divergence) |
| Supertrend (4H) | Bullish above $3,497 |
| VWAP (Session) | $3,660.77 (neutral) |
| DMI ADX (14) | 18.96 (weak trend forming) |
| Netflow (Aug 5, 05:30) | -$122.70M (heavy exchange outflows) |
| Monthly Fib 0.236 Level | $3,496.72 (macro resistance zone) |
What’s Happening With Ethereum’s Price?
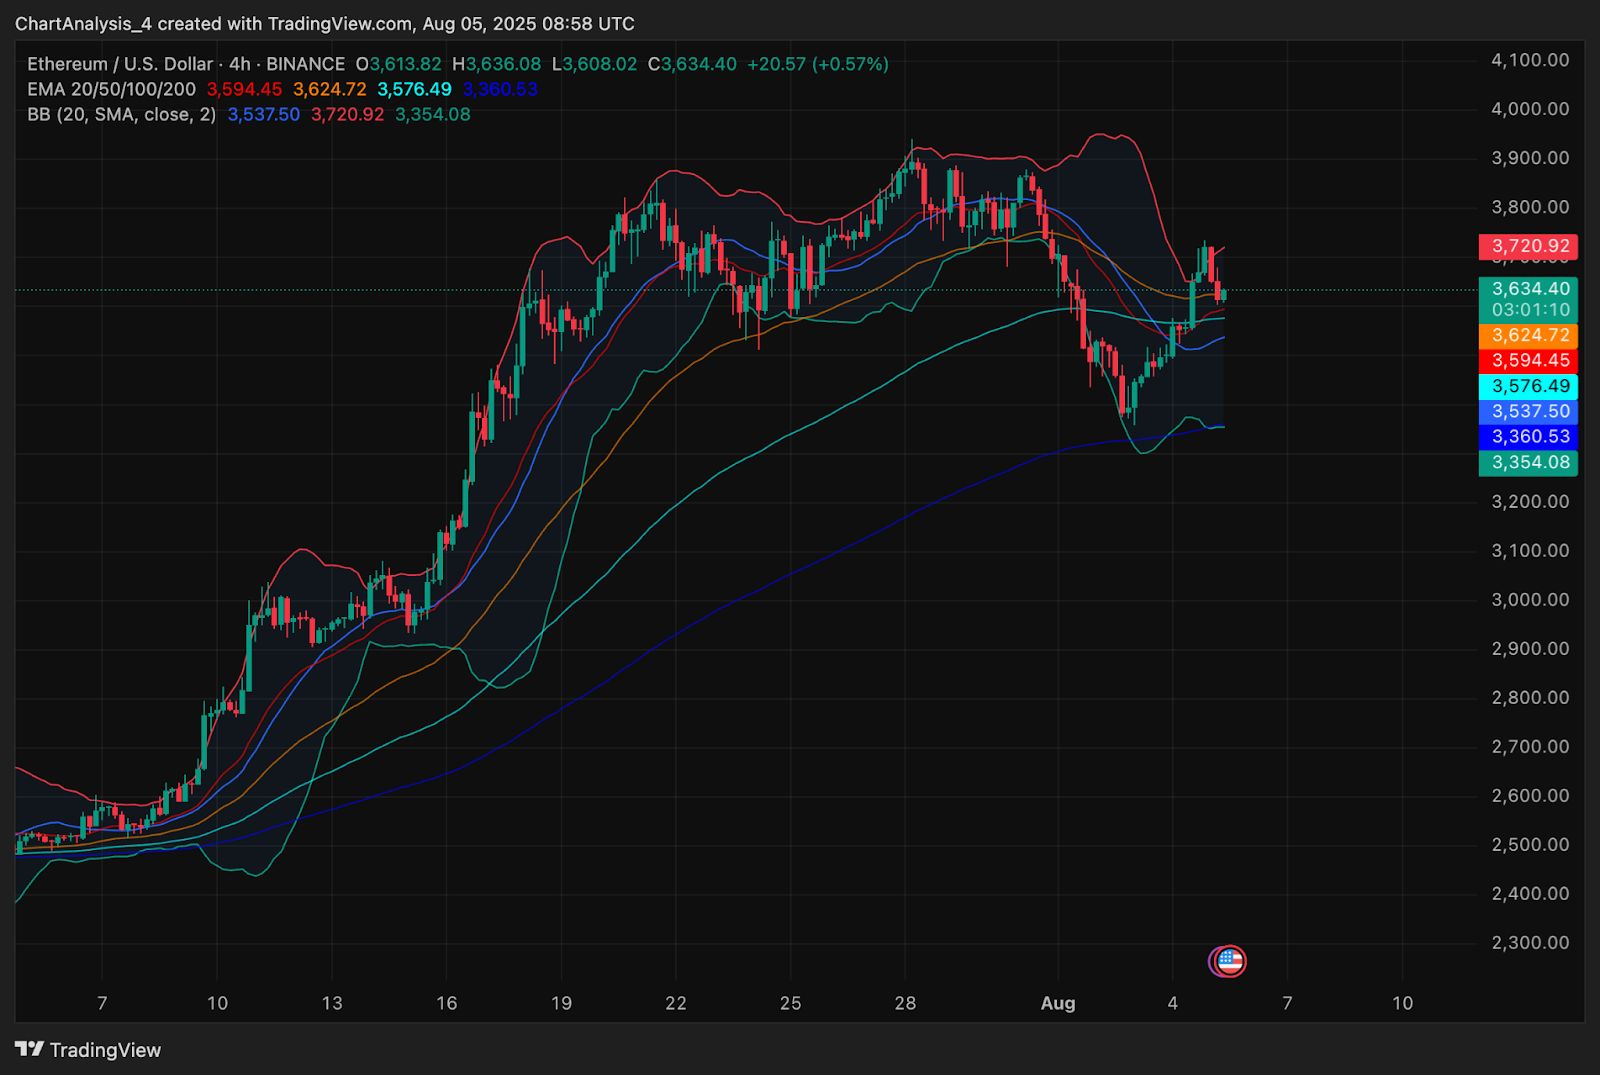
On the 4-hour chart, Ethereum price action shows a clean bounce from below $3,400, supported by a dynamic cluster of EMAs (100 EMA at $3,576, 200 EMA at $3,360). The bullish move reclaimed the Bollinger midline but lost steam at the upper band boundary, which aligns with the $3,720 zone.
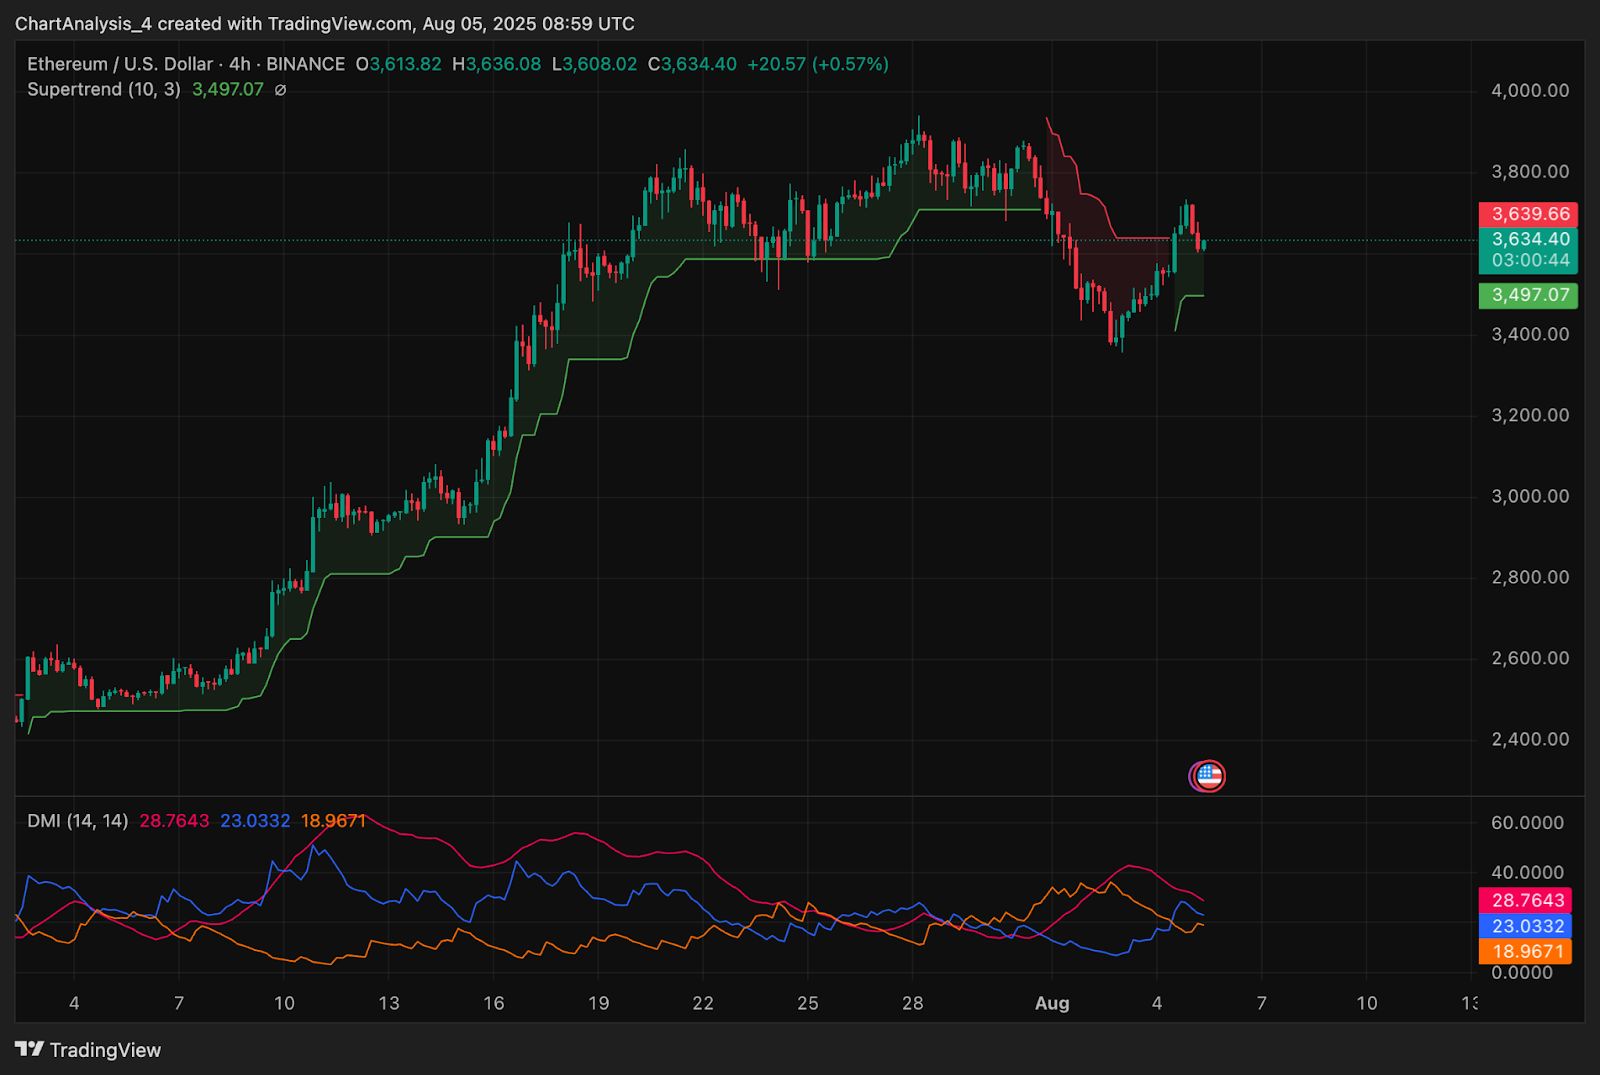
While the short-term trend has shifted positive, Bollinger Bands are beginning to flatten and squeeze near current price, indicating compression and indecision. Meanwhile, Supertrend has flipped bullish again with support now seen at $3,497, and candles are still trading just above this level.
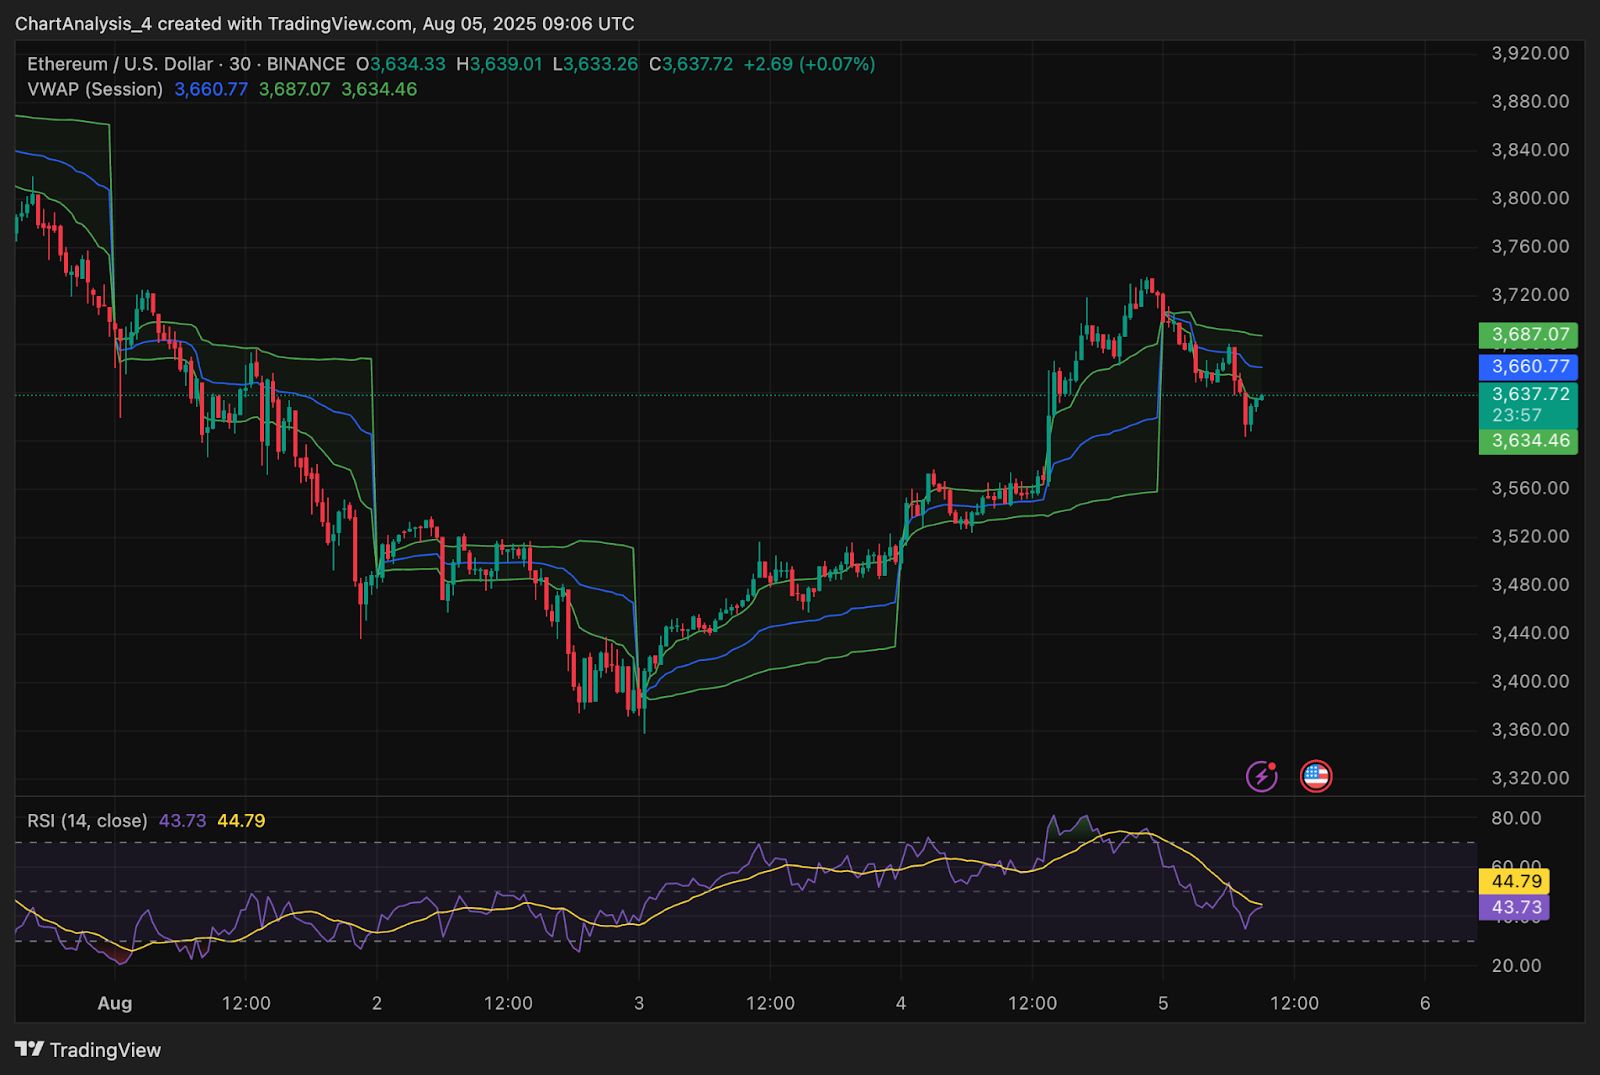
However, the 30-minute RSI has slipped to 43.73, signaling fading strength, while price is hovering at the VWAP baseline near $3,634. The DMI indicator also shows a decline in directional momentum, with ADX falling toward 19 and +DI crossing back below -DI, reflecting an early weakness after the rally.
Why Is The Ethereum Price Going Down Today?
Why Ethereum price going down today stems from both technical rejection and heavy profit-taking. The $3,720 to $3,735 band represents a prior distribution zone from late July, and today’s candle failed to break past this resistance despite a strong bullish wick.
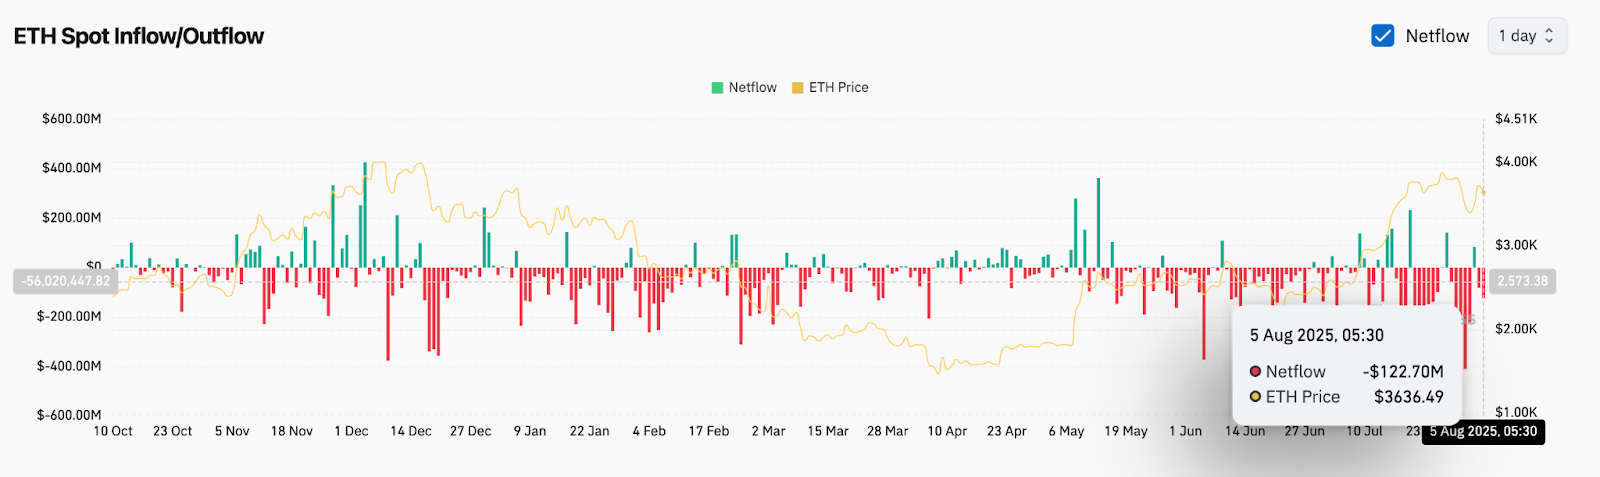
On the spot market side, Coinglass netflow data shows $122.7 million in outflows over the past 24 hours, the highest in nearly three weeks. This surge in outflows signals increased exchange selling pressure, particularly after the 15 percent rally from July’s $3,200 base.
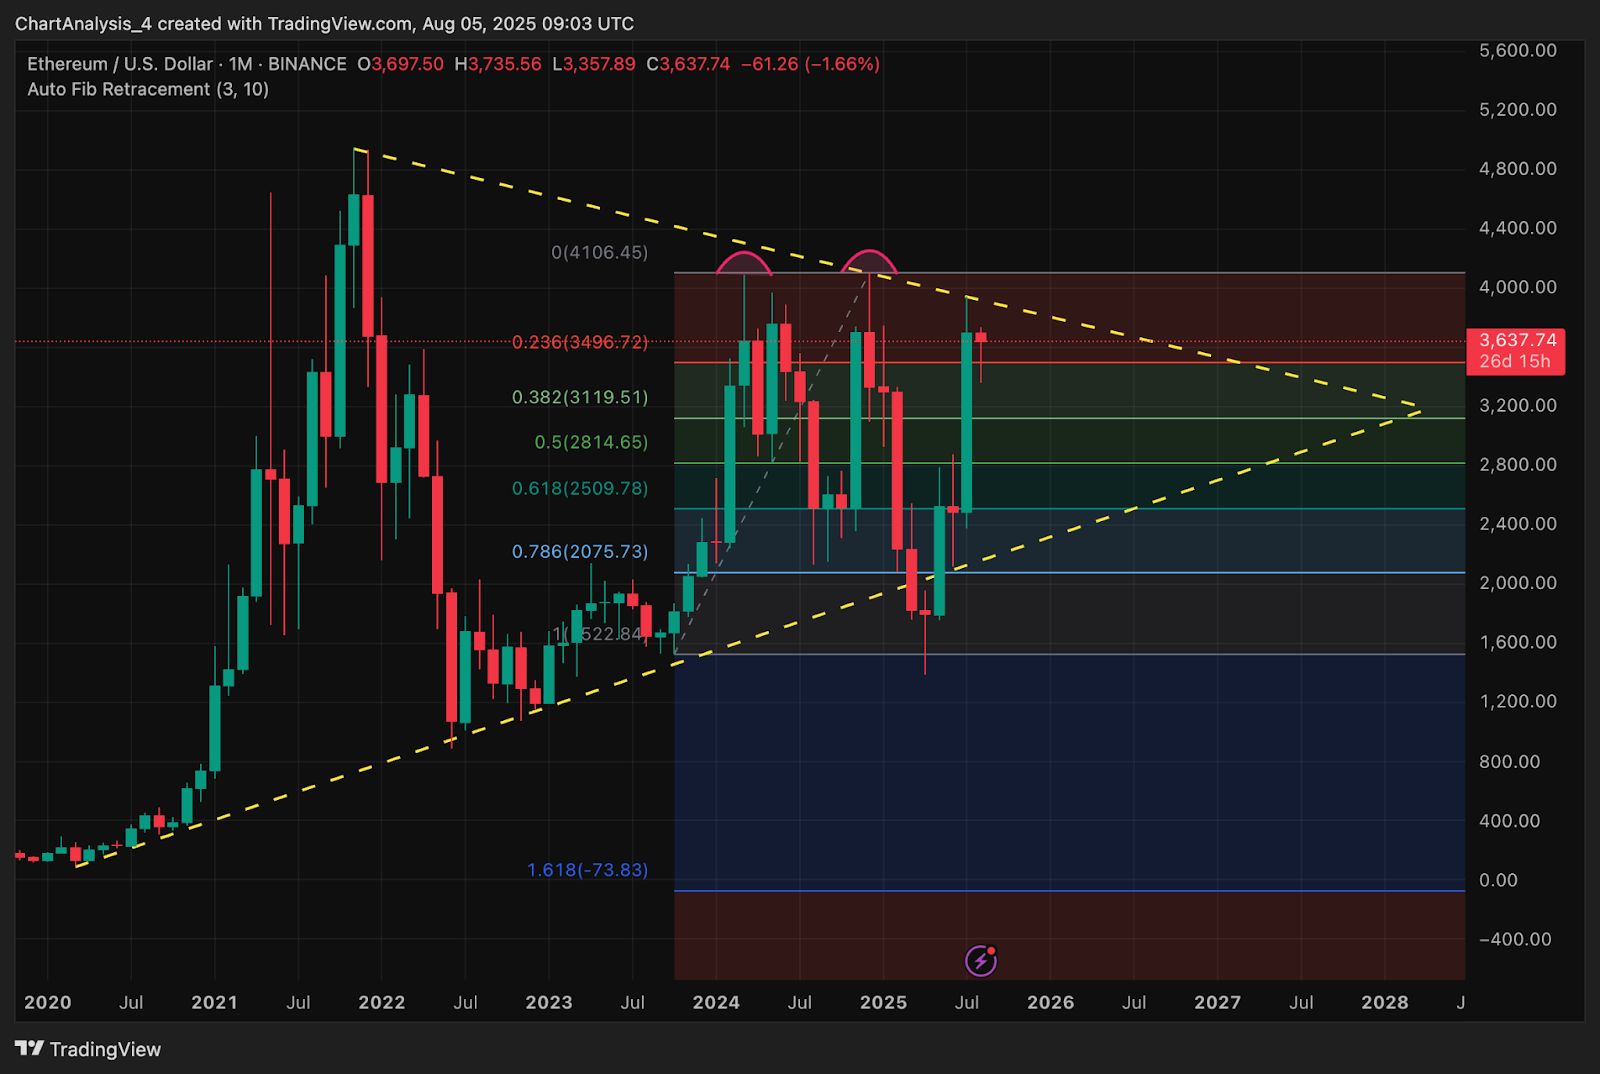
The monthly chart also reveals ETH is struggling near the 0.236 Fibonacci retracement at $3,496.72, a zone that previously triggered rejections multiple times since late 2021. This macro-level resistance is further reinforced by the long-term triangle formation with converging support near $2,800 and overhead pressure just below $4,100.
Key Levels and Chart Structure to Watch
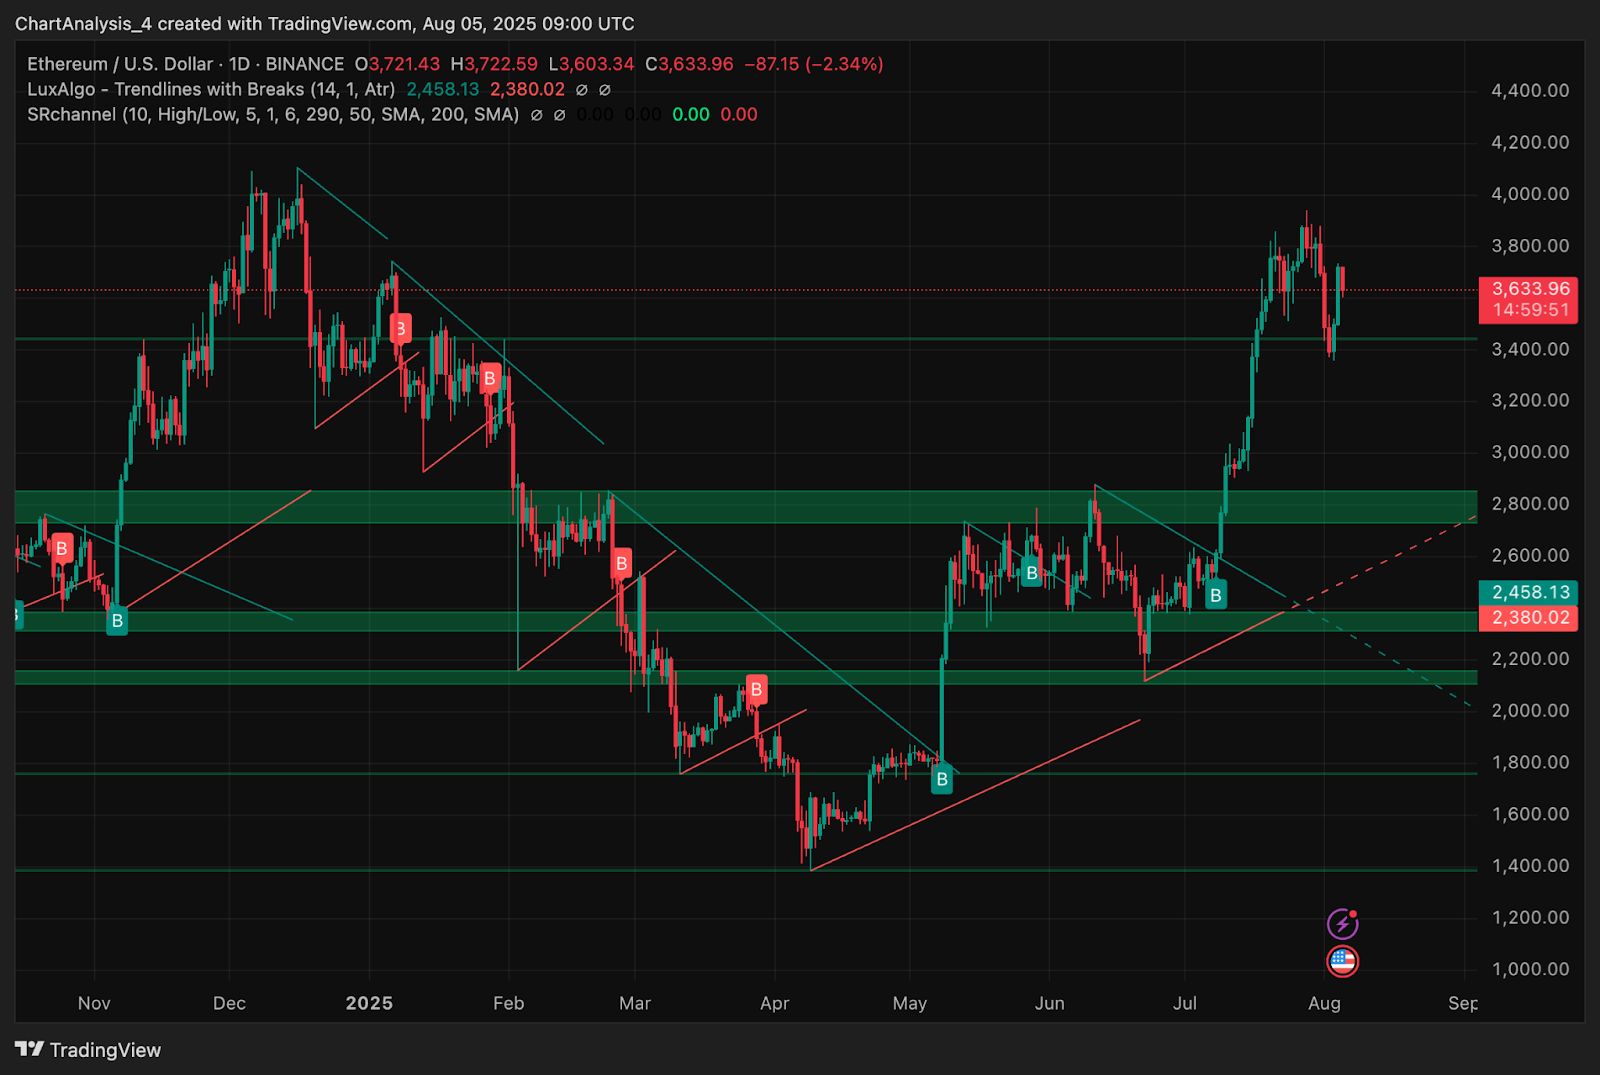
From a daily perspective, Ethereum price remains structurally bullish after breaking above the falling wedge pattern in July. However, the rising support trendline connecting May and July lows now sits near $3,400, a level that must hold if bulls want to defend the uptrend.
On the 4-hour view, price is currently pinned between key EMA levels. The 20 and 50 EMAs ($3,594 and $3,624) offer immediate support, while the 100 EMA sits slightly below at $3,576. Below this, the next critical support rests near the 200 EMA at $3,360, also close to the prior breakout region.
The VWAP channel is tightening around $3,660 and $3,687. If ETH fails to recover above $3,660 in the next few sessions, sellers may push toward the $3,500 to $3,520 liquidity pocket.
ETH Price Prediction: Short-Term Outlook (24H)
If Ethereum price holds above the $3,590 to $3,624 range, there remains scope for another upward attempt toward $3,720. A clean break above that level, paired with bullish RSI and MACD cross, could open the path toward $3,850 and then $4,000.
On the downside, a close below $3,576 would trigger a deeper test of the 200 EMA zone near $3,360. This would invalidate the short-term bullish structure and risk dragging ETH back toward the trendline support at $3,200.
With sentiment shaken by negative netflows and failing momentum indicators, the next 24 hours will be pivotal. A breakout above $3,720 or breakdown below $3,576 will likely define Ethereum’s next move.
Disclaimer: The content of this article solely reflects the author's opinion and does not represent the platform in any capacity. This article is not intended to serve as a reference for making investment decisions.
You may also like
How much CPO demand will Nvidia Rubin Ultra generate? Bernstein: Optical value per Pod will increase fivefold
Bernstein believes that the co-packaged optics (CPO) and fiber demand driven by Nvidia's Rubin Ultra architecture will surge significantly, with the optical content per Pod rising from $1 million to $5.4 million. This will propel the size of Nvidia's optical ecosystem market to $46.8 billion by 2028 (a 91% annual increase). Although the industry faces supply bottlenecks with InP substrates, the outlook remains positive. The institution reiterates its “outperform” rating for Lumentum, Coherent, and Ciena.
UBS Q3 implements a two-way strategy with gold options, heavily invests in technology stocks, and builds positions in SK Hynix (SKHY.US)
UBS Group (UBS.US) has submitted its Q3 holdings report (13F) as of September 30, 2026.
SpaceX (SPCX.US) reportedly attempts “de-Nvidiaization” at the rack level: developing Kessel cabinets to bypass L6 compute boards, purchasing only chips
SemiAnalysis: SpaceX has developed its own Kessel cabinet, bypassing Nvidia's L6 cards to provide more options for manufacturing its own hardware.

$3.7 billion “data center power equipment prepayments” abandoned! What did "the most active buyer of gas turbines", SoftBank, see?
In the second quarter of fiscal year 2026, SoftBank reported a net loss of $7.1 billion, primarily due to a $3.7 billion impairment charge from a $9.5 billion advance payment for power generation equipment for US data centers—of which about $2.9 billion was non-refundable and effectively lost. The CFO admitted that SoftBank placed orders before the project plan was finalized, and is now conducting a comprehensive review of its procurement strategy. "The most aggressive purchaser of gas turbines has now written off the deposit in this way."
Crypto prices
More


