

Ethereum is currently testing the critical $3,500 support level, which is essential for confirming a bullish breakout toward $4,800. Holding this support could prevent further declines and signal strong upward momentum for ETH.
-
Ethereum’s $3,500 support is crucial to maintain bullish momentum and avoid deeper corrections.
-
ETH’s Elliott Wave analysis indicates it is in Wave 2, with Wave 3 targeting a rally past $4,800 if key supports hold.
-
A decisive break above $3,800 resistance would confirm trend continuation, while failure risks a drop to $3,200 or lower.
Ethereum tests key $3,500 support amid bullish breakout signals. Discover ETH’s next moves and market outlook with COINOTAG’s expert analysis.
-
Ethereum’s price action near $3,500 highlights a pivotal support zone critical for market direction.
-
The Elliott Wave pattern suggests a potential strong rally if support levels hold steady.
-
COINOTAG analysts emphasize the importance of volume and price response at resistance and support zones.
Ethereum price analysis reveals key support and resistance levels shaping its near-term trajectory. Stay informed with COINOTAG’s detailed coverage.
How Is Ethereum’s $3,500 Support Level Influencing Market Sentiment?
Ethereum’s $3,500 support level is a critical price point that traders watch closely to gauge bullish or bearish momentum. After a sharp 10% pullback from near $3,900, ETH currently trades around $3,553.87, testing this key zone. Holding above $3,500 suggests buyers remain confident, preventing a deeper decline and setting the stage for a potential breakout.
What Does Ethereum’s Elliott Wave Pattern Indicate About Future Price Movements?
According to Elliott Wave theory, Ethereum is currently in Wave 2 of a five-wave impulse pattern. Wave 1 saw a rise from $2,400 to $3,800, while Wave 2 is a corrective phase near $3,458.70. Analysts forecast Wave 3 to push prices beyond $4,800, with Wave 5 potentially reaching $5,200. This structure highlights a bullish trend if support zones between $3,150 and $3,200 hold firm.

What Are the Key Resistance and Support Zones Defining Ethereum’s Market Outlook?
Ethereum faces immediate resistance between $3,800 and $4,000, with support near $3,500 and deeper support zones at $2,800 to $2,600. The $3,800 level, previously a resistance, now acts as a critical hurdle for bulls. A successful break above this range could propel ETH toward $4,000 and higher. Conversely, failure to hold $3,500 may trigger a pullback toward $3,200 or even $2,800, testing earlier breakout levels.
How Did Ethereum’s Recent Downtrend Reverse and What Does That Mean?
Ethereum’s downtrend reversal began in late May with a breakout above descending resistance near $2,600. This breakout followed multiple support bounces between $2,400 and $2,600, establishing a strong base. The rally pushed ETH past $3,800, briefly reaching near $3,900 before the recent pullback. Despite volatility, ETH remains above the breakout zone, signaling sustained bullish momentum.
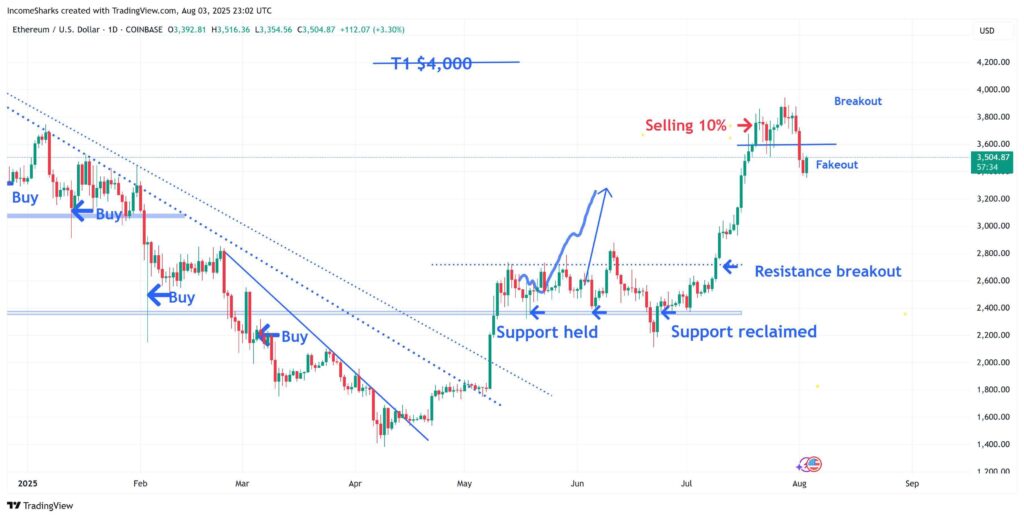
ETH/USD 1-day price chart, Source: IncomeSharks on X
What Are the Implications of Ethereum’s Wave Structure for Traders?
Ethereum’s wave structure suggests an ongoing impulse formation, indicating strong bullish potential. The five-wave pattern mirrors the 2023 cycle where Wave 3 was the strongest rally. Current corrections in Wave 2 near $3,458.70 are typical before a Wave 3 surge. Traders should watch for confirmation above $3,800 to validate this trend continuation.
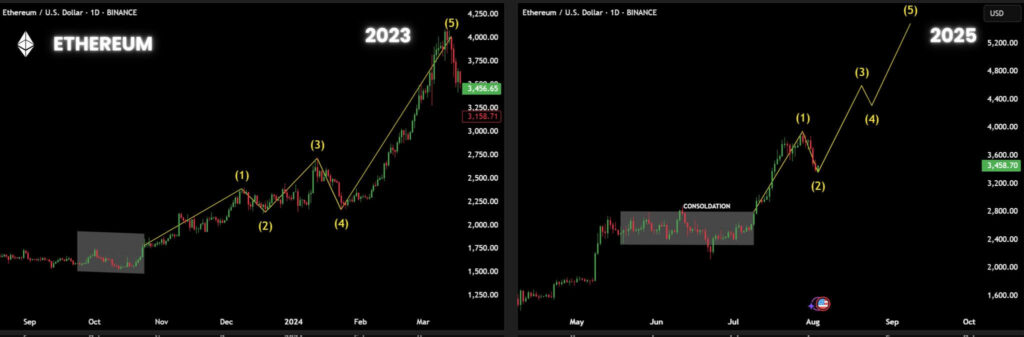
ETH/USD 1-day price chart, Source: RJT WAGMI on X
Frequently Asked Questions
What is the significance of Ethereum’s $3,500 support level?
Ethereum’s $3,500 support is a crucial price point that helps determine whether the market will continue its bullish trend or face a deeper correction. Holding this level signals strength and potential for upward momentum.
How does Ethereum’s Elliott Wave pattern affect price predictions?
The Elliott Wave pattern indicates Ethereum is in a corrective Wave 2, with Wave 3 expected to drive prices above $4,800. This pattern helps traders anticipate future price movements based on historical cycles.
Key Takeaways
- Critical Support: Ethereum’s $3,500 level is vital for maintaining bullish momentum and avoiding deeper declines.
- Wave Analysis: Elliott Wave theory suggests ETH is in Wave 2, with a strong Wave 3 rally anticipated above $4,800.
- Resistance Zones: The $3,800–$4,000 range is a key resistance area that must be reclaimed for continued upward movement.
Conclusion
Ethereum’s current test of the $3,500 support level is a pivotal moment for its near-term price trajectory. Maintaining this support is essential for confirming a bullish breakout toward $4,800 and beyond. Traders and investors should monitor volume and price action closely at these key zones to gauge momentum. COINOTAG will continue providing expert insights as the market evolves.





