
HBAR Price Pattern Shows Why Traders Need to Brace for More Pain Ahead

HBAR has dropped sharply, with technical indicators signaling more downside ahead. Traders are watching for either a bounce or deeper losses.
Hedera Hashgraph’s native token HBAR has plummeted by 15% over the past week, dragged down by a broader market pullback.
As the crypto market continues to show signs of weakening momentum, technical indicators suggest HBAR’s downturn may be far from over.
HBAR Drops Under 20-Day EMA as Bears Take Over
Readings from the one-day chart show that HBAR’s double-digit decline has pushed its price below the 20-day Exponential Moving Average (EMA).
As of this writing, this key moving average forms dynamic resistance above the token’s price at $0.2446. For context, HBAR currently trades at $0.2391.
Want more token insights like this? Sign up for Editor Harsh Notariya’s Daily Crypto Newsletter
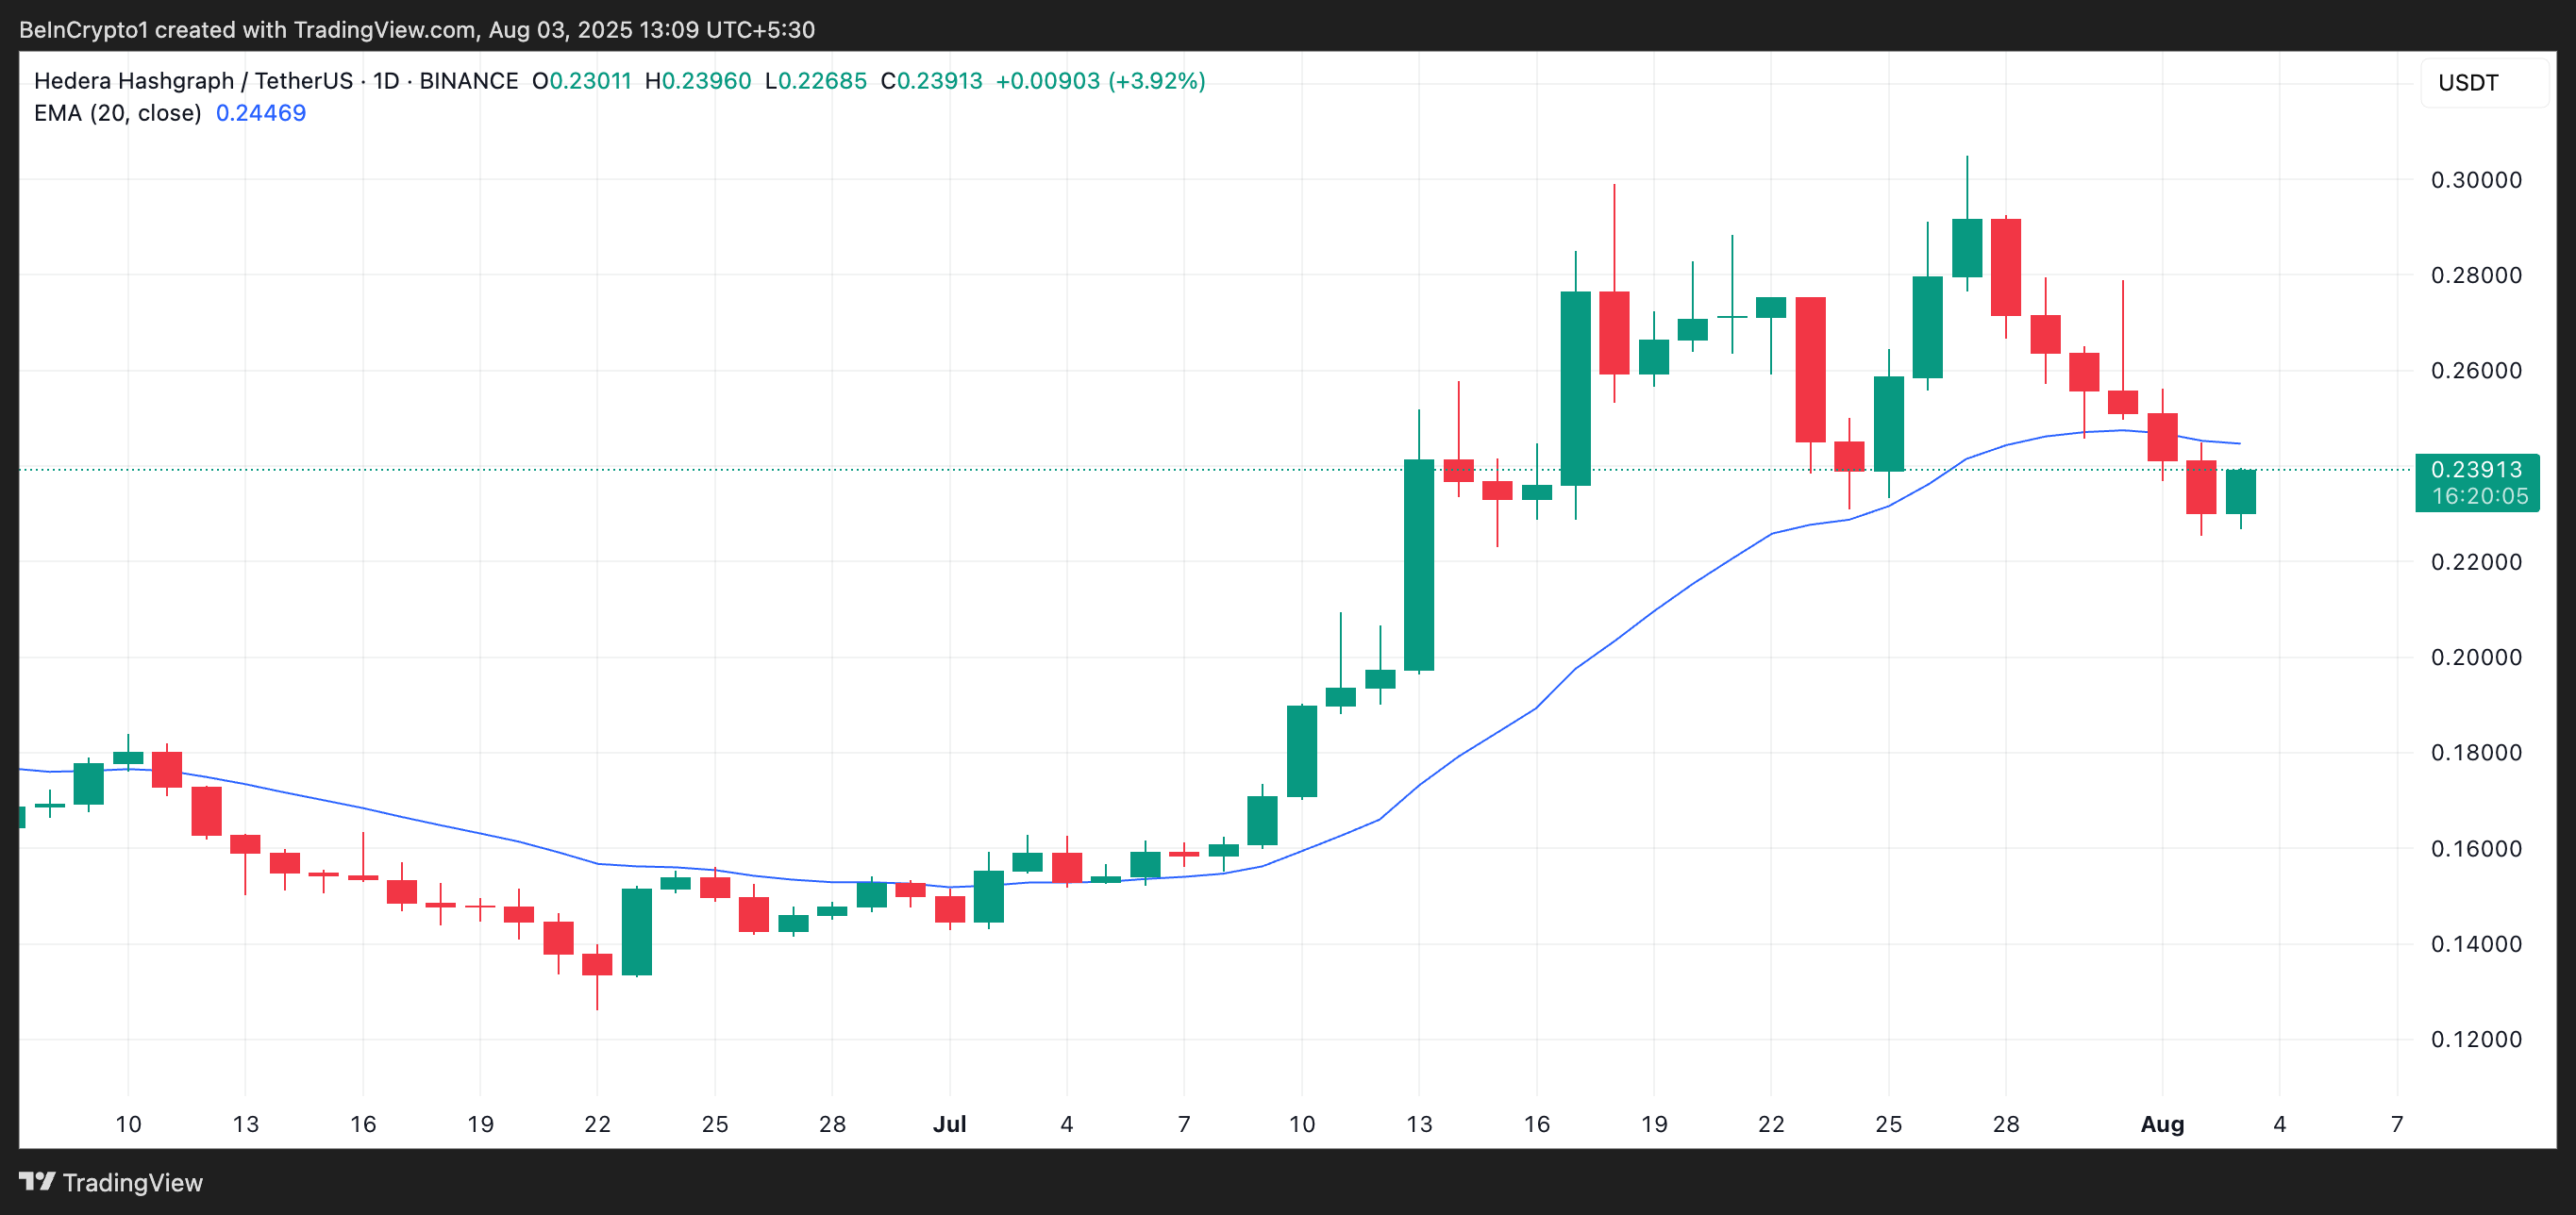 HBAR 20-Day EMA. Source:
TradingView
The 20-day EMA measures an asset’s average price over the past 20 trading days, giving weight to recent prices. When price trades above the 20-day EMA, it signals short-term bullish momentum and suggests buyers are in control.
On the other hand, when an asset’s price breaks below this level, it signals increased sell-side pressure and weakening short-term support. This puts HBAR at risk of logging more losses over the next few trading sessions.
Furthermore, the setup of the altcoin’s Moving Average Convergence Divergence (MACD) indicator supports this bearish outlook.
As of this writing, HBAR’s MACD line (blue) rests below the signal line (orange), while the red histogram bars have grown in size — a sign that bearish momentum is accelerating.
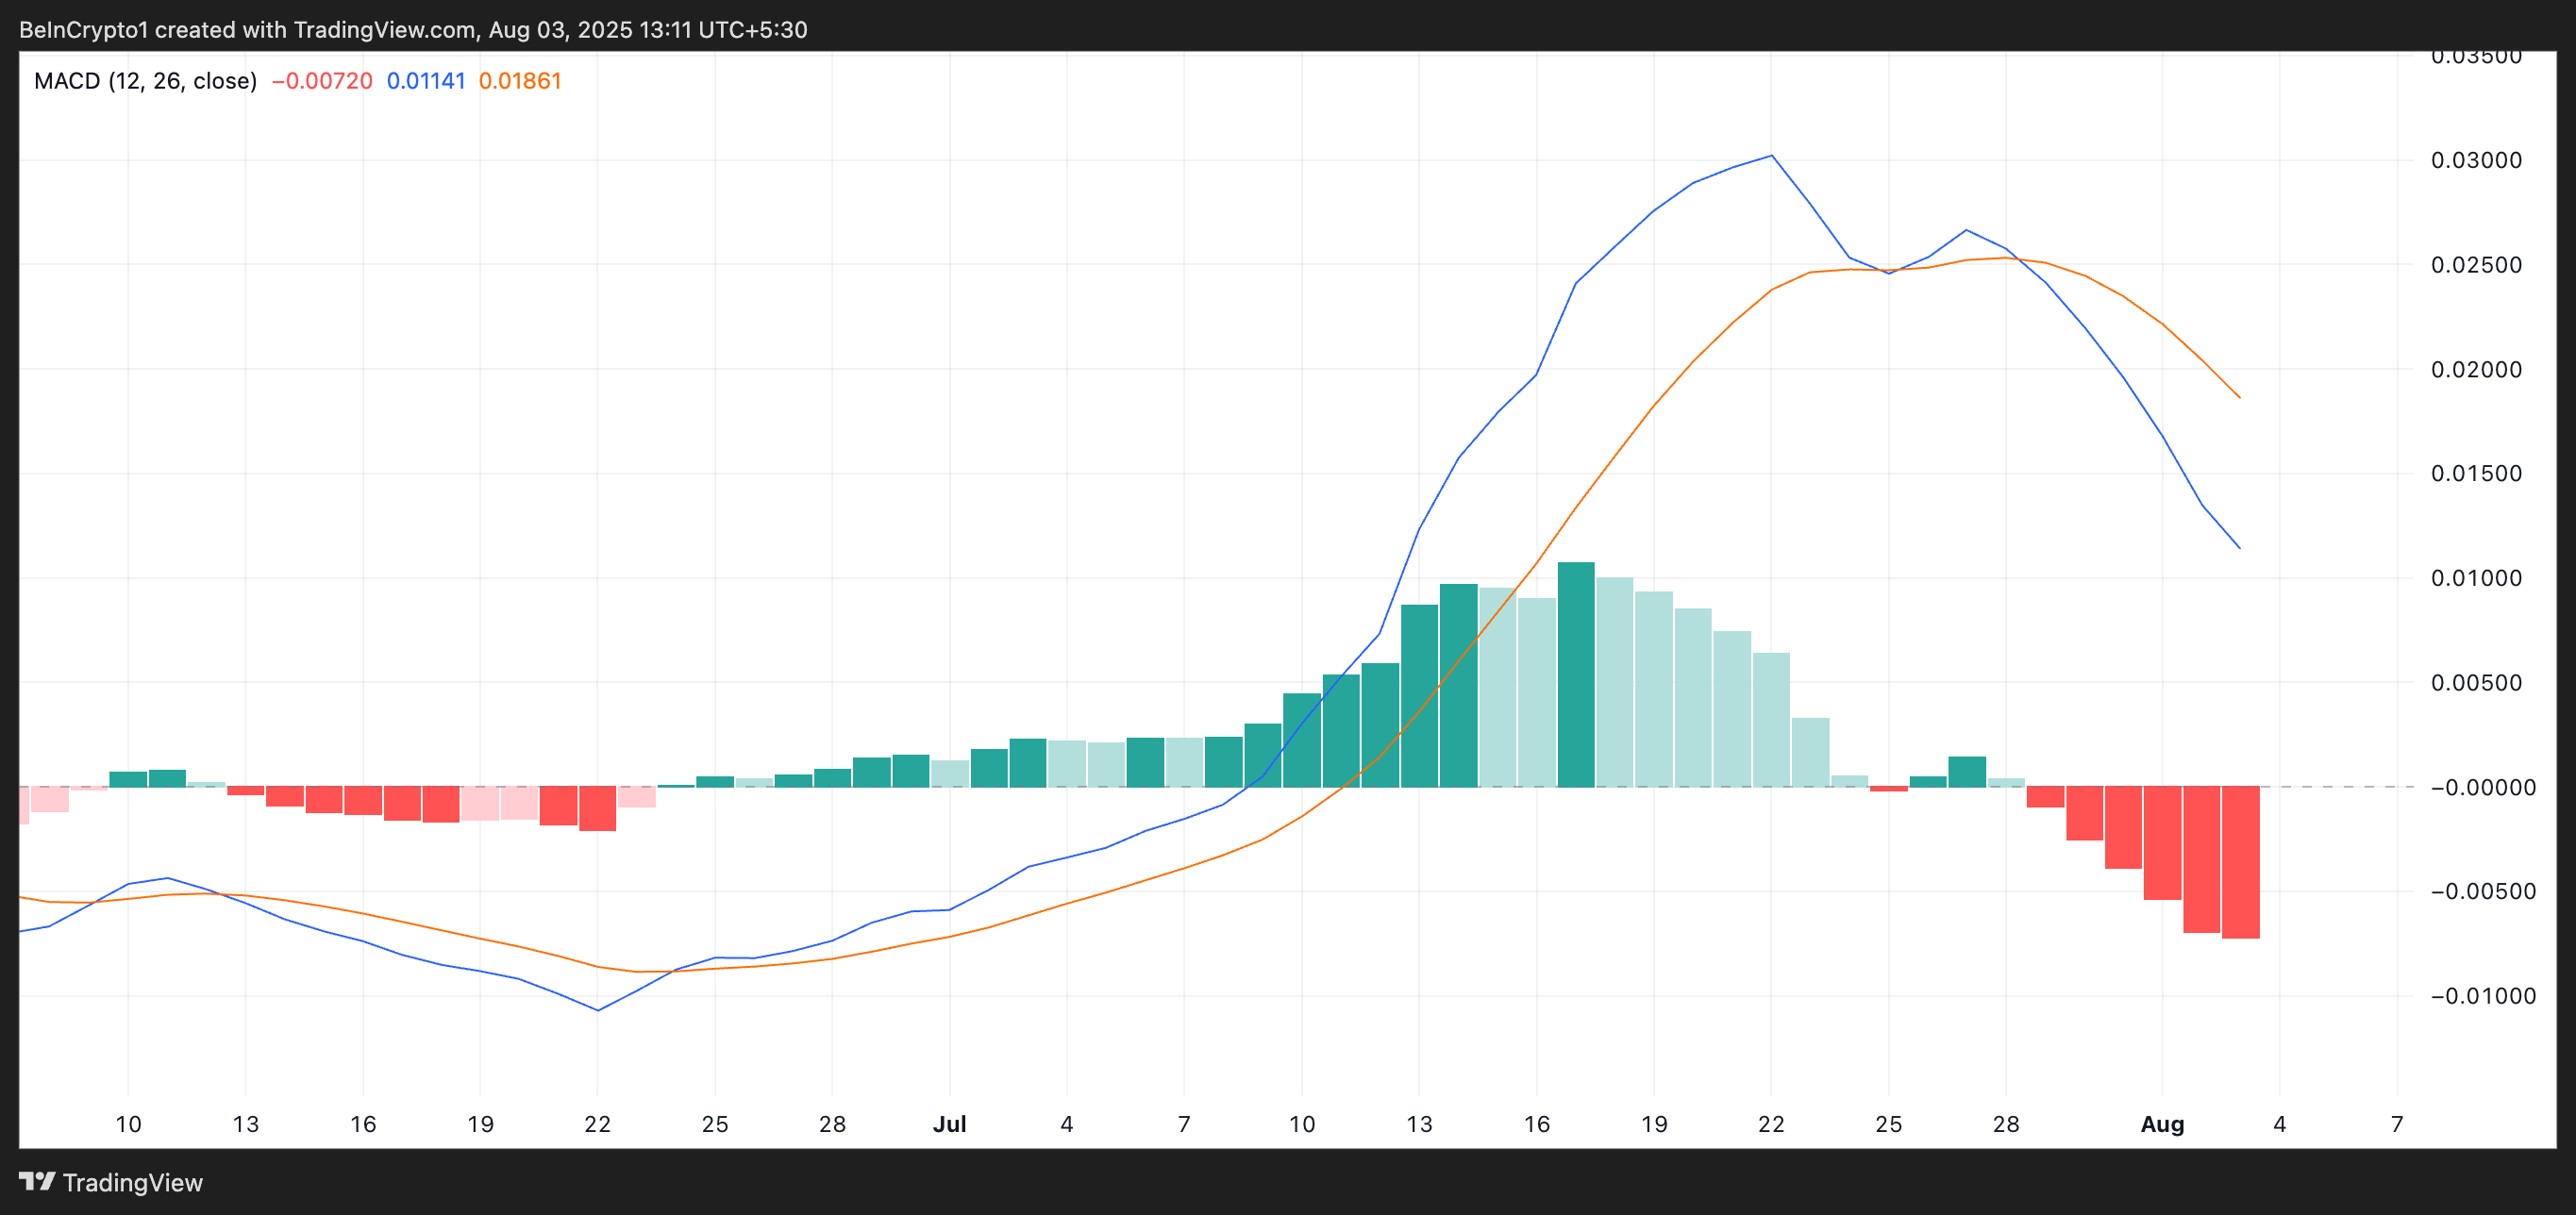 HBAR MACD. Source:
TradingView
The MACD indicator identifies trends and momentum in its price movement. It helps traders spot potential buy or sell signals through crossovers between the MACD and signal lines.
As with HBAR, when the MACD line rests below the signal line, it signals declining buying pressure and growing sell-side strength. This further supports the case for continued downside in the short term.
Can a Sentiment Shift Save the Token?
HBAR may be on course for deeper losses in the coming days as selloffs strengthen. In this scenario, its price could fall below $0.2283.
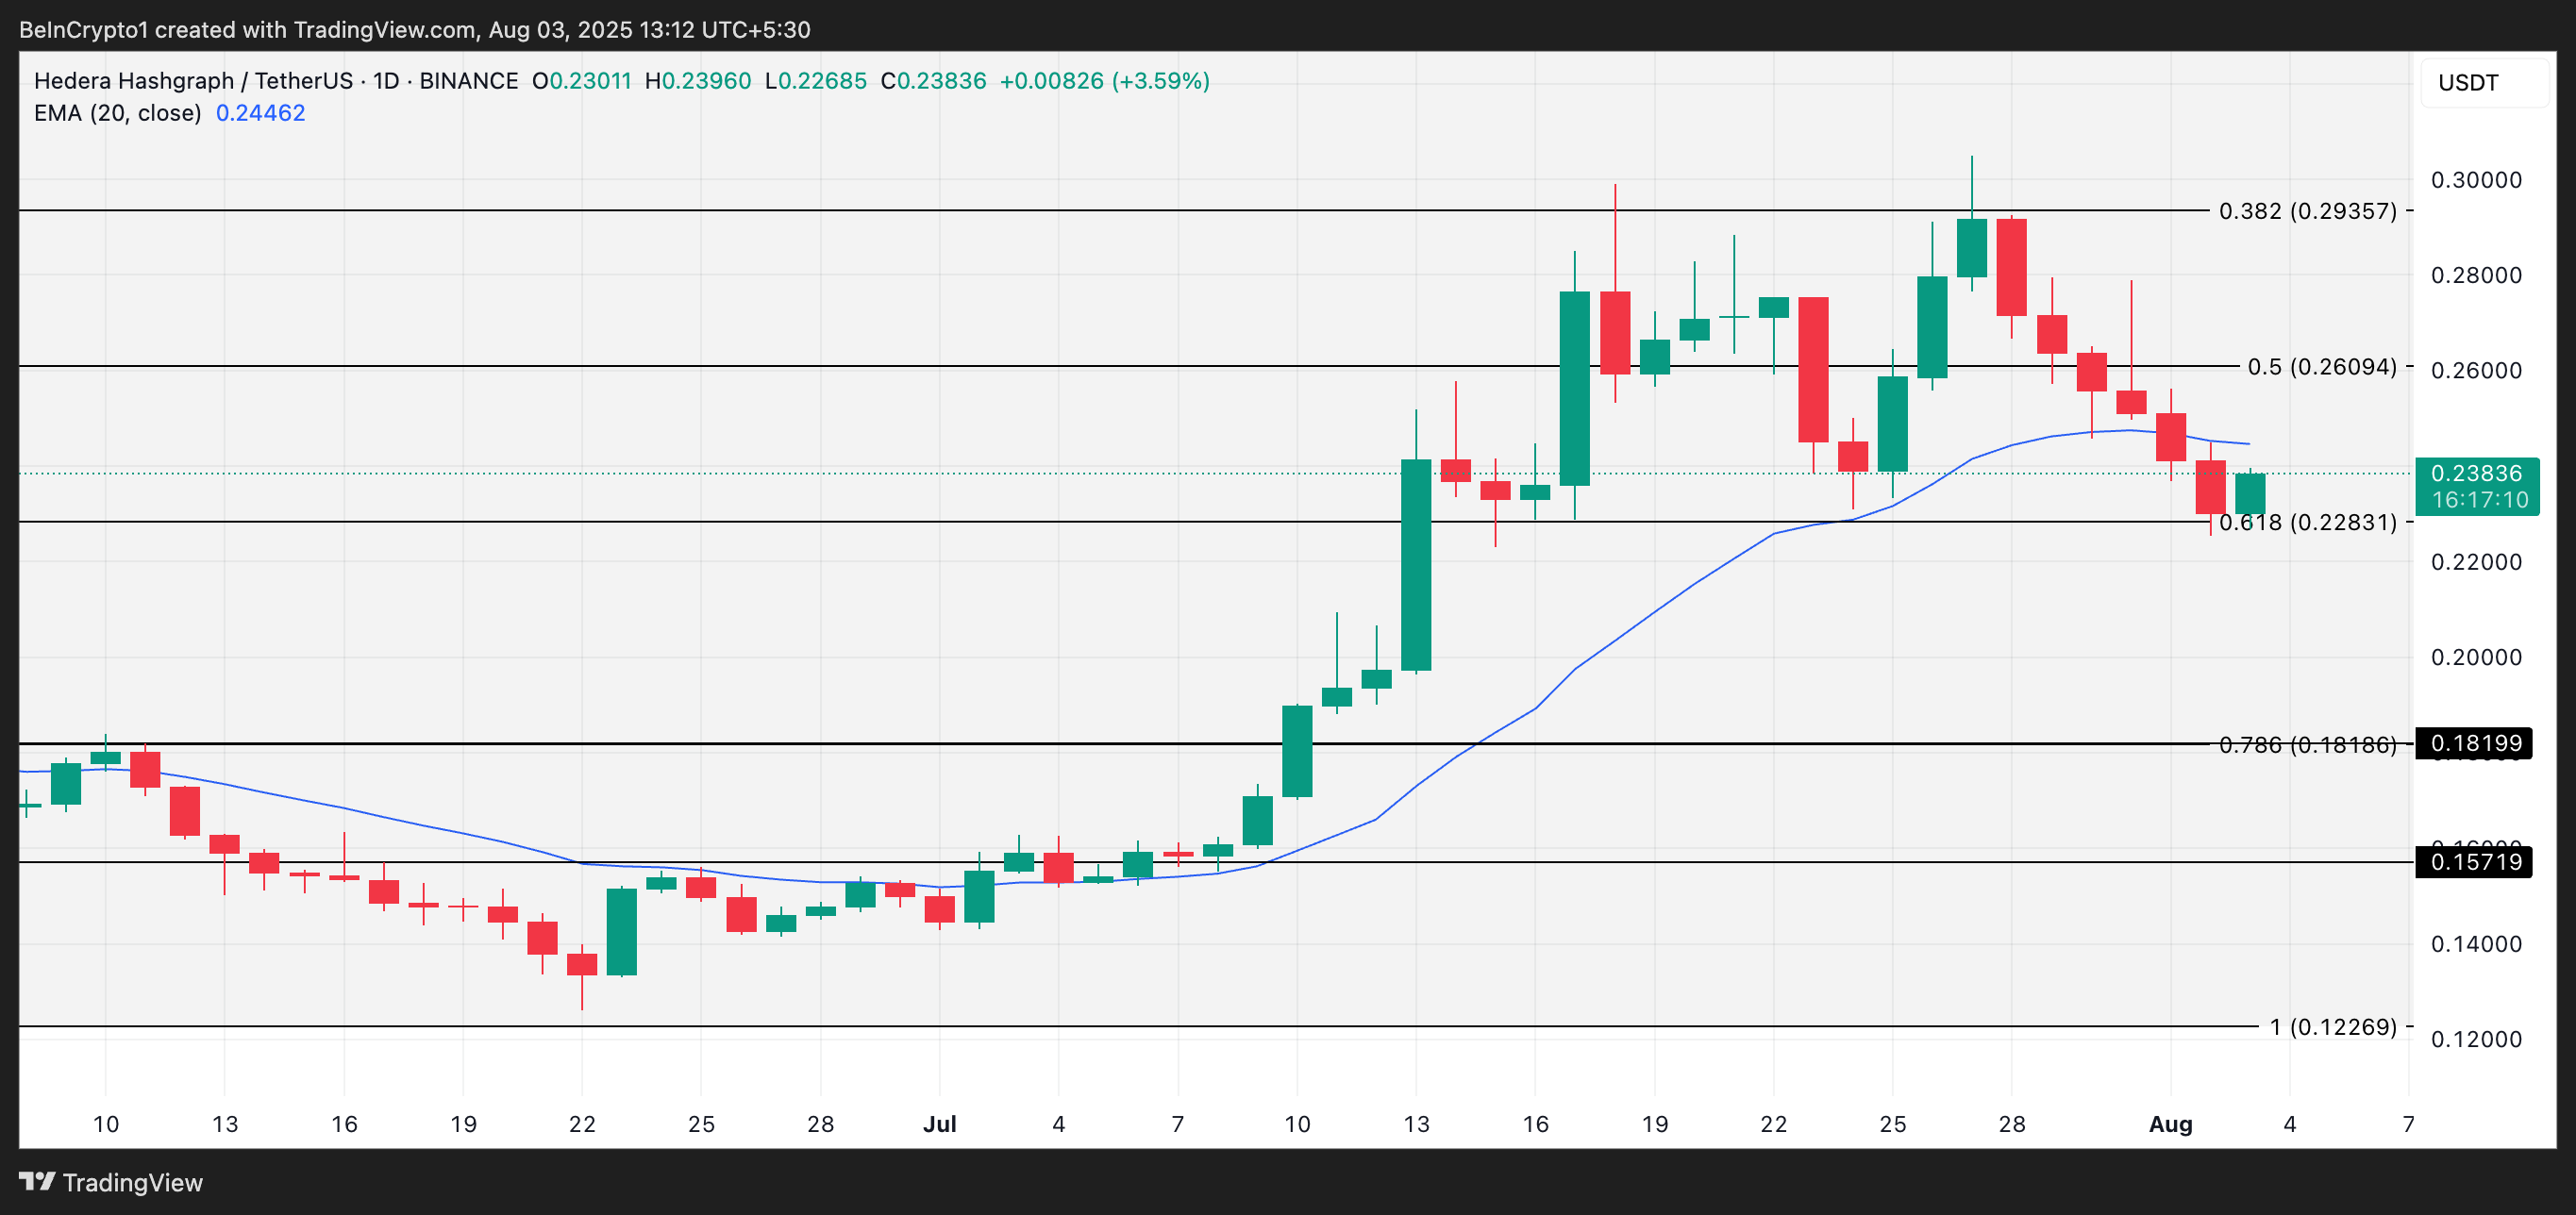 HBAR Price Analysis. Source:
TradingView
However, if sentiment shifts and a strong support base forms, it could drive the token’s price past the 20-day EMA and toward $0.2609.
Disclaimer: The content of this article solely reflects the author's opinion and does not represent the platform in any capacity. This article is not intended to serve as a reference for making investment decisions.
You may also like
How much CPO demand will Nvidia Rubin Ultra generate? Bernstein: Optical value per Pod will increase fivefold
Bernstein believes that the co-packaged optics (CPO) and fiber demand driven by Nvidia's Rubin Ultra architecture will surge significantly, with the optical content per Pod rising from $1 million to $5.4 million. This will propel the size of Nvidia's optical ecosystem market to $46.8 billion by 2028 (a 91% annual increase). Although the industry faces supply bottlenecks with InP substrates, the outlook remains positive. The institution reiterates its “outperform” rating for Lumentum, Coherent, and Ciena.

UBS Q3 implements a two-way strategy with gold options, heavily invests in technology stocks, and builds positions in SK Hynix (SKHY.US)
UBS Group (UBS.US) has submitted its Q3 holdings report (13F) as of September 30, 2026.

SpaceX (SPCX.US) reportedly attempts “de-Nvidiaization” at the rack level: developing Kessel cabinets to bypass L6 compute boards, purchasing only chips
SemiAnalysis: SpaceX has developed its own Kessel cabinet, bypassing Nvidia's L6 cards to provide more options for manufacturing its own hardware.

$3.7 billion “data center power equipment prepayments” abandoned! What did "the most active buyer of gas turbines", SoftBank, see?
In the second quarter of fiscal year 2026, SoftBank reported a net loss of $7.1 billion, primarily due to a $3.7 billion impairment charge from a $9.5 billion advance payment for power generation equipment for US data centers—of which about $2.9 billion was non-refundable and effectively lost. The CFO admitted that SoftBank placed orders before the project plan was finalized, and is now conducting a comprehensive review of its procurement strategy. "The most aggressive purchaser of gas turbines has now written off the deposit in this way."
Crypto prices
More


