

After months of consolidation below a falling trendline, Memecoin (MEME) is showing its first signs of structural improvement. While downside risks remain due to low liquidity and fading hype, the recent breakout attempt and indicator alignment suggest that bulls may be regaining control.
Memecoin (MEME) Price Prediction 2025
 MEME price dynamics (Source: TradingView)
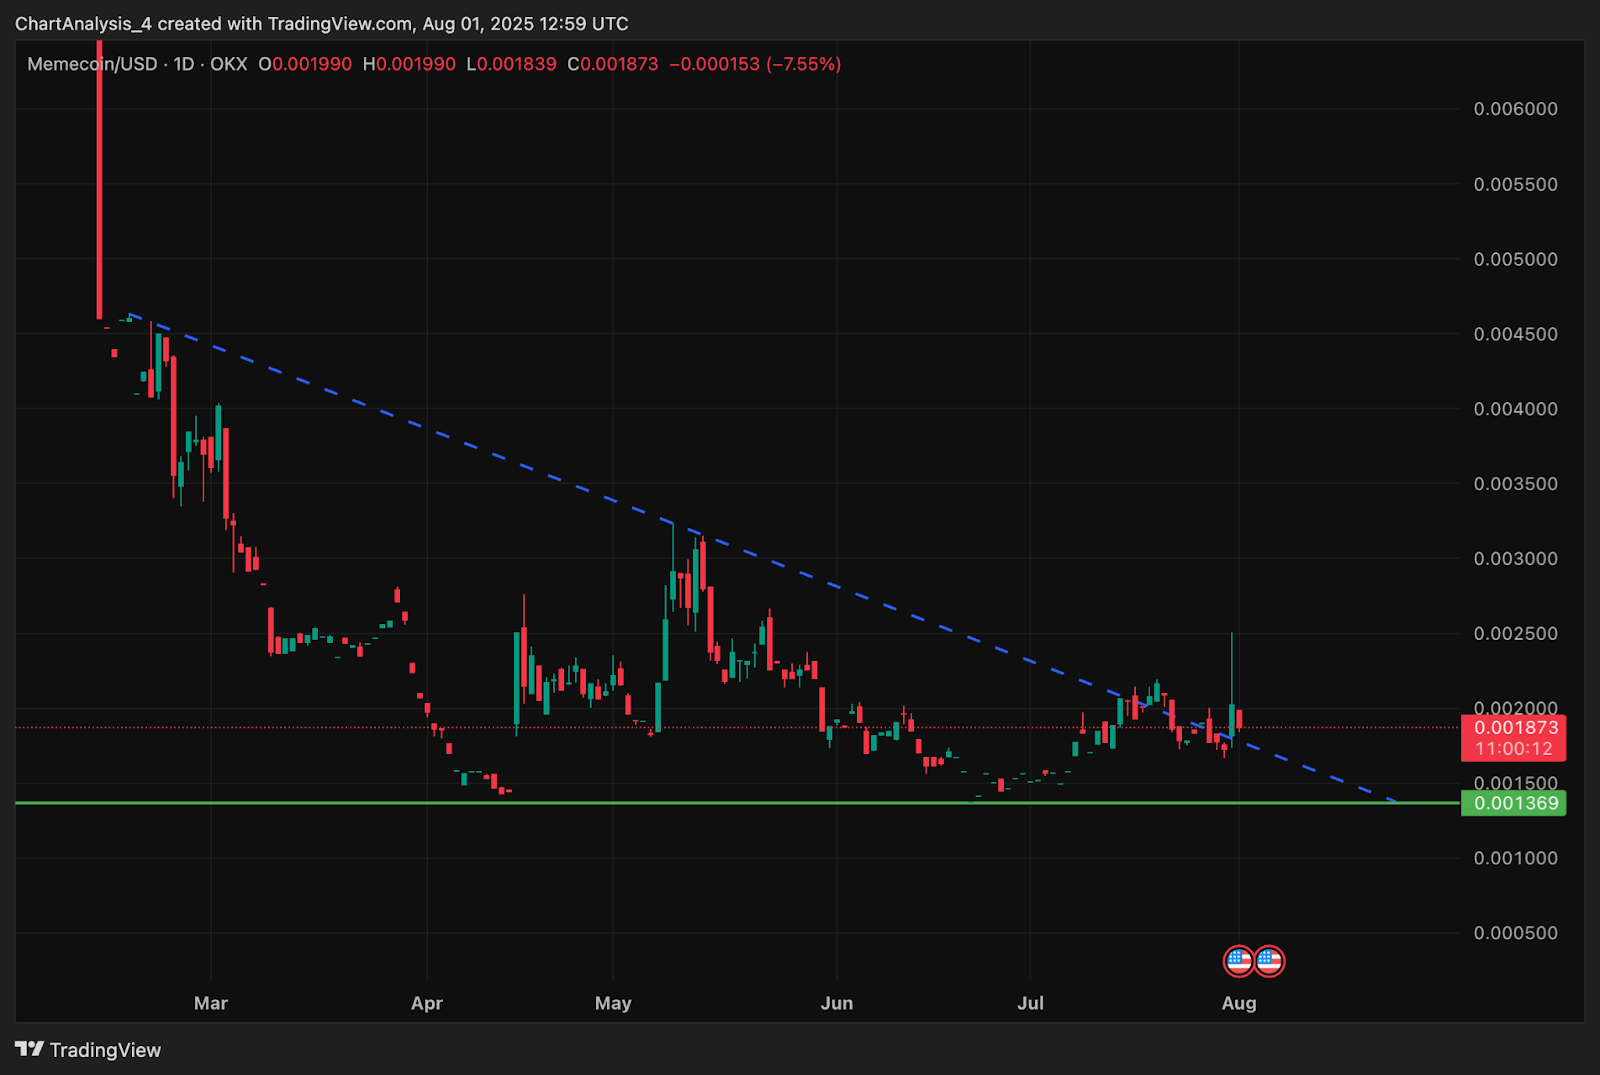
The MEME price is currently trading near $0.00187, hovering just above a long-standing descending trendline that has capped all recovery attempts since March. After bottoming near the $0.00136 zone, price has tested this key breakout level multiple times, and the latest spike above $0.0025 hints at renewed demand.
The daily chart reveals a breakout attempt through the trendline, with key horizontal support now visible at $0.00136. While the intraday candle has retraced, bulls are expected to defend this structure into early 2025 as the market attempts a recovery phase.
EMA Cluster and Bollinger Band Expansion Suggest Breakout Setup
 MEME price dynamics (Source: TradingView)
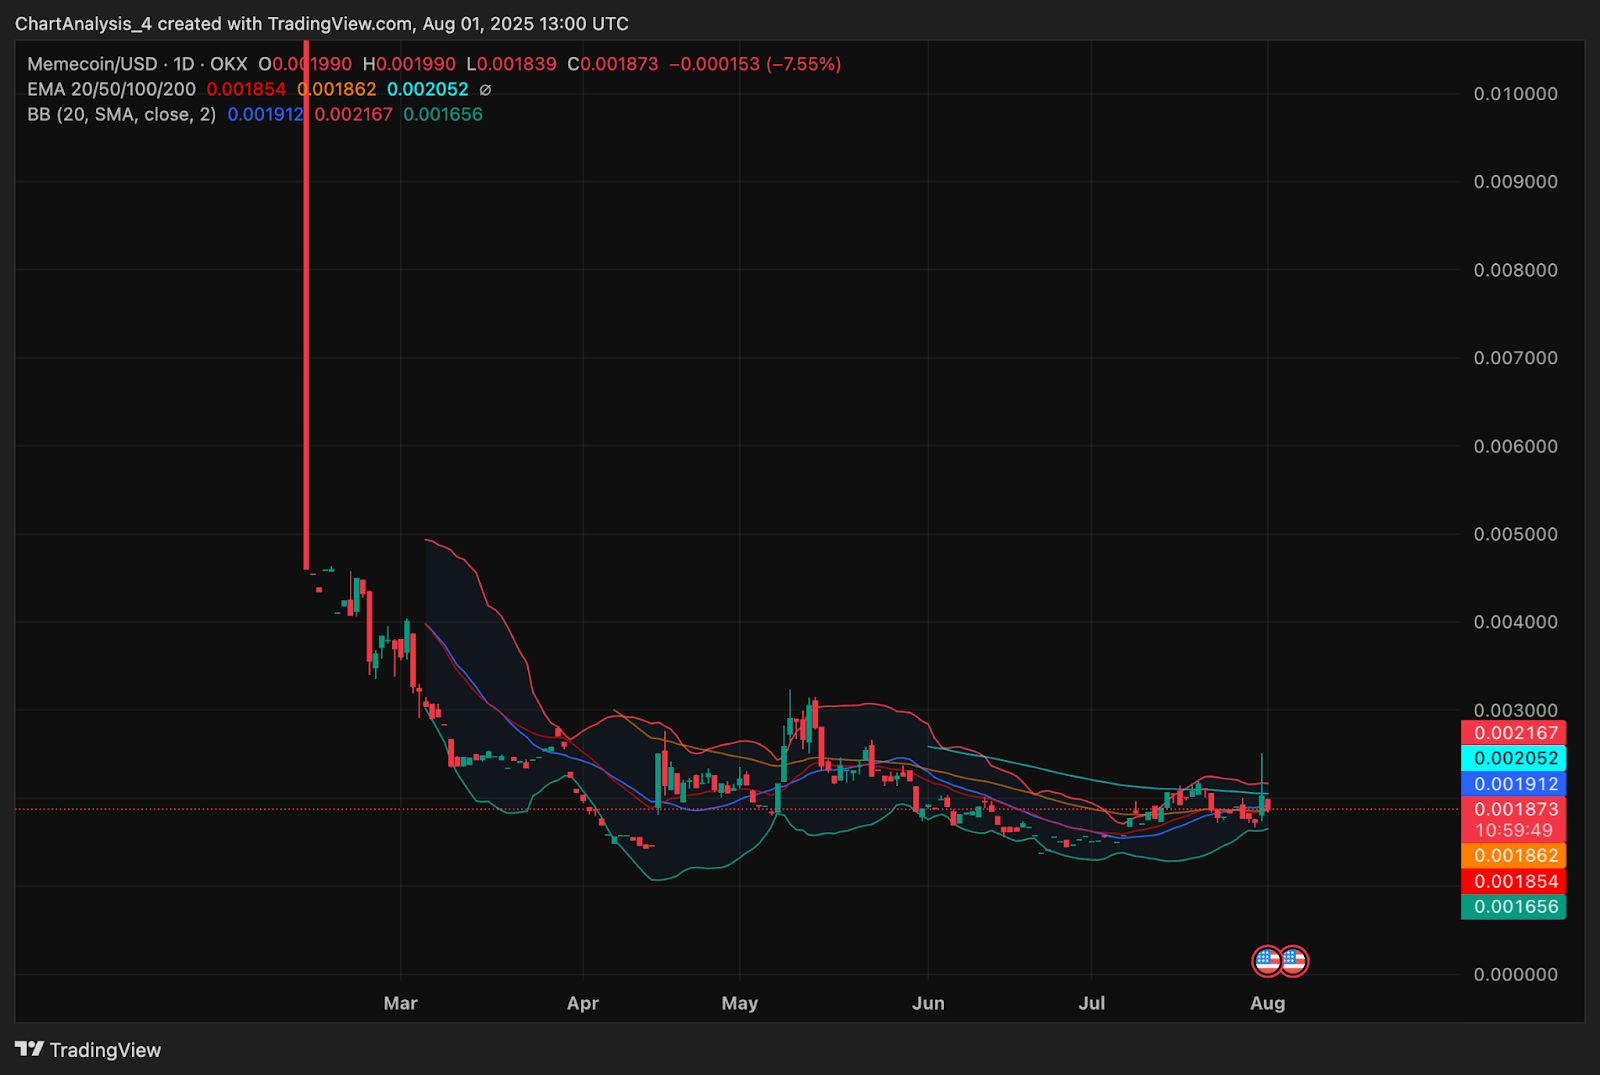
On the daily chart, MEME has reclaimed the 20-day and 50-day exponential moving averages, now positioned around $0.00185 and $0.00186 respectively. The 100-day EMA at $0.00205 still acts as resistance, but the flattening curve indicates that bearish momentum is weakening.
Bollinger Bands are widening after a long period of contraction, a classic signal that volatility is entering the market. Price has pierced the upper band on short-term spikes, indicating the possibility of breakout acceleration if volume confirms.
RSI Momentum and Parabolic SAR Flip
 MEME price dynamics (Source: TradingView)
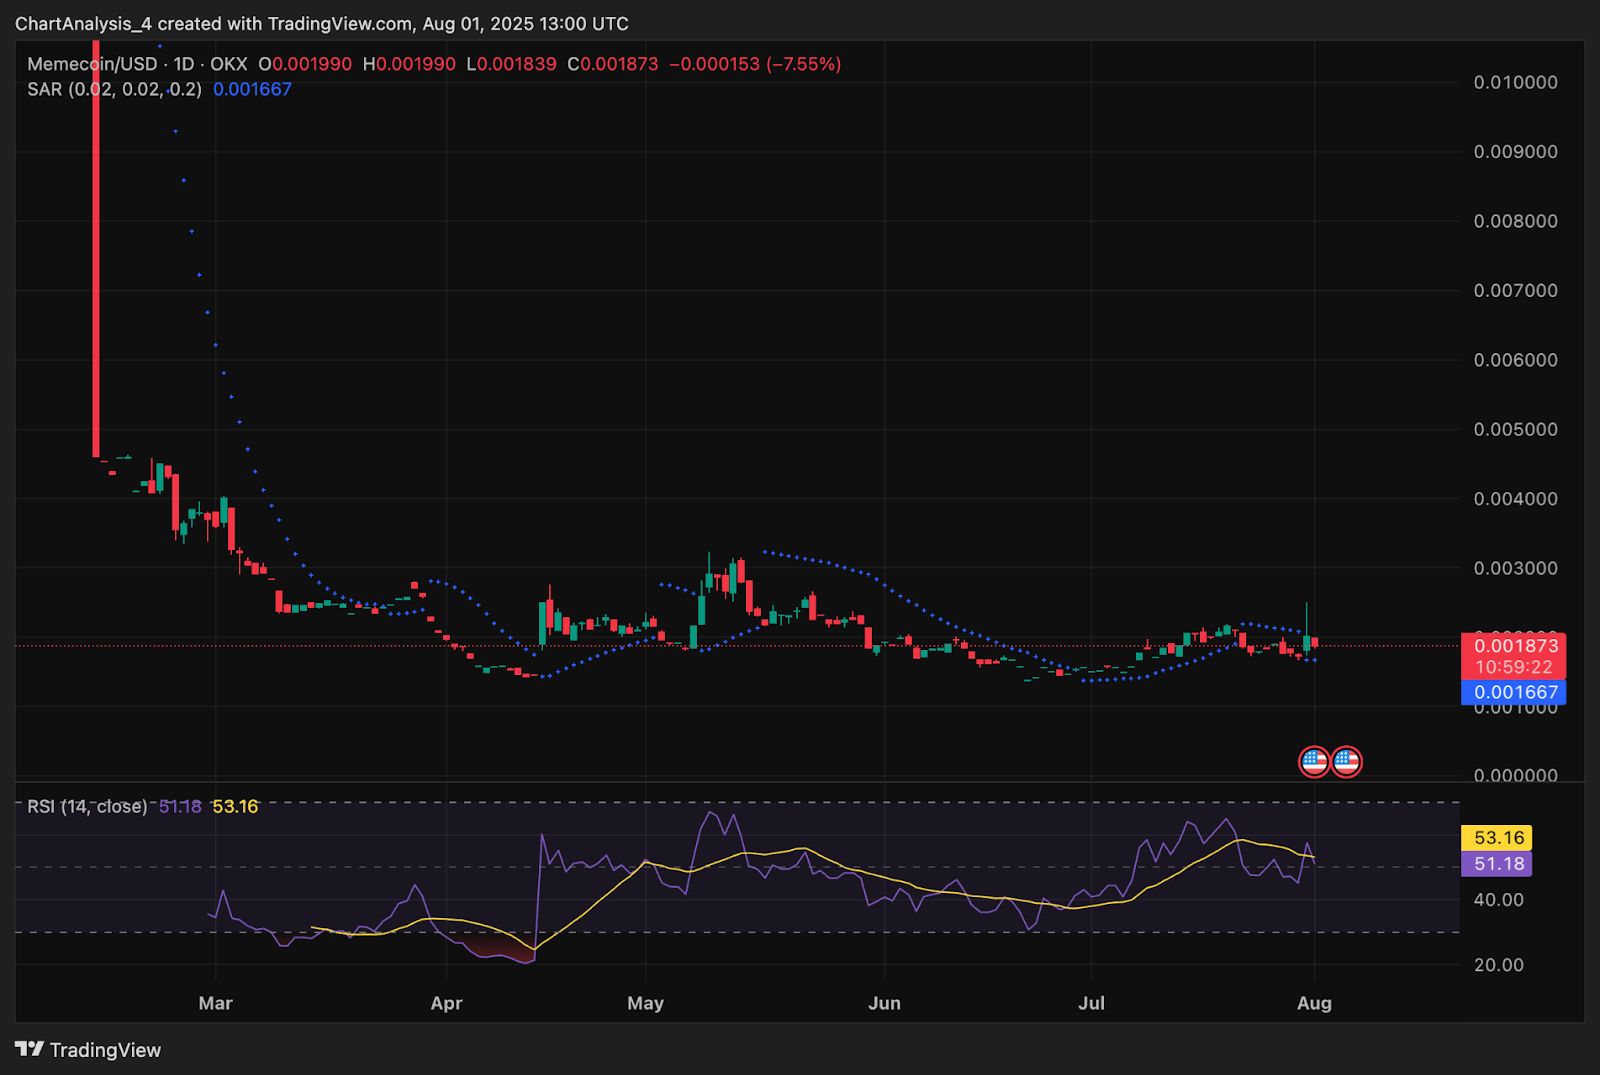
The Relative Strength Index (RSI) on the daily chart is currently at 53.16, recovering from sub-40 levels seen in June. This neutral-to-bullish reading supports the thesis of momentum rebuilding. If RSI holds above 50, further strength toward the $0.00220–$0.00250 range may follow.
The Parabolic SAR has flipped below the price for the first time since the June breakdown, signaling a trend reversal confirmation. Traders may continue to use SAR positioning to trail support on any rally.
Supertrend and Trendline Interaction on Lower Timeframe
 MEME price dynamics (Source: TradingView)
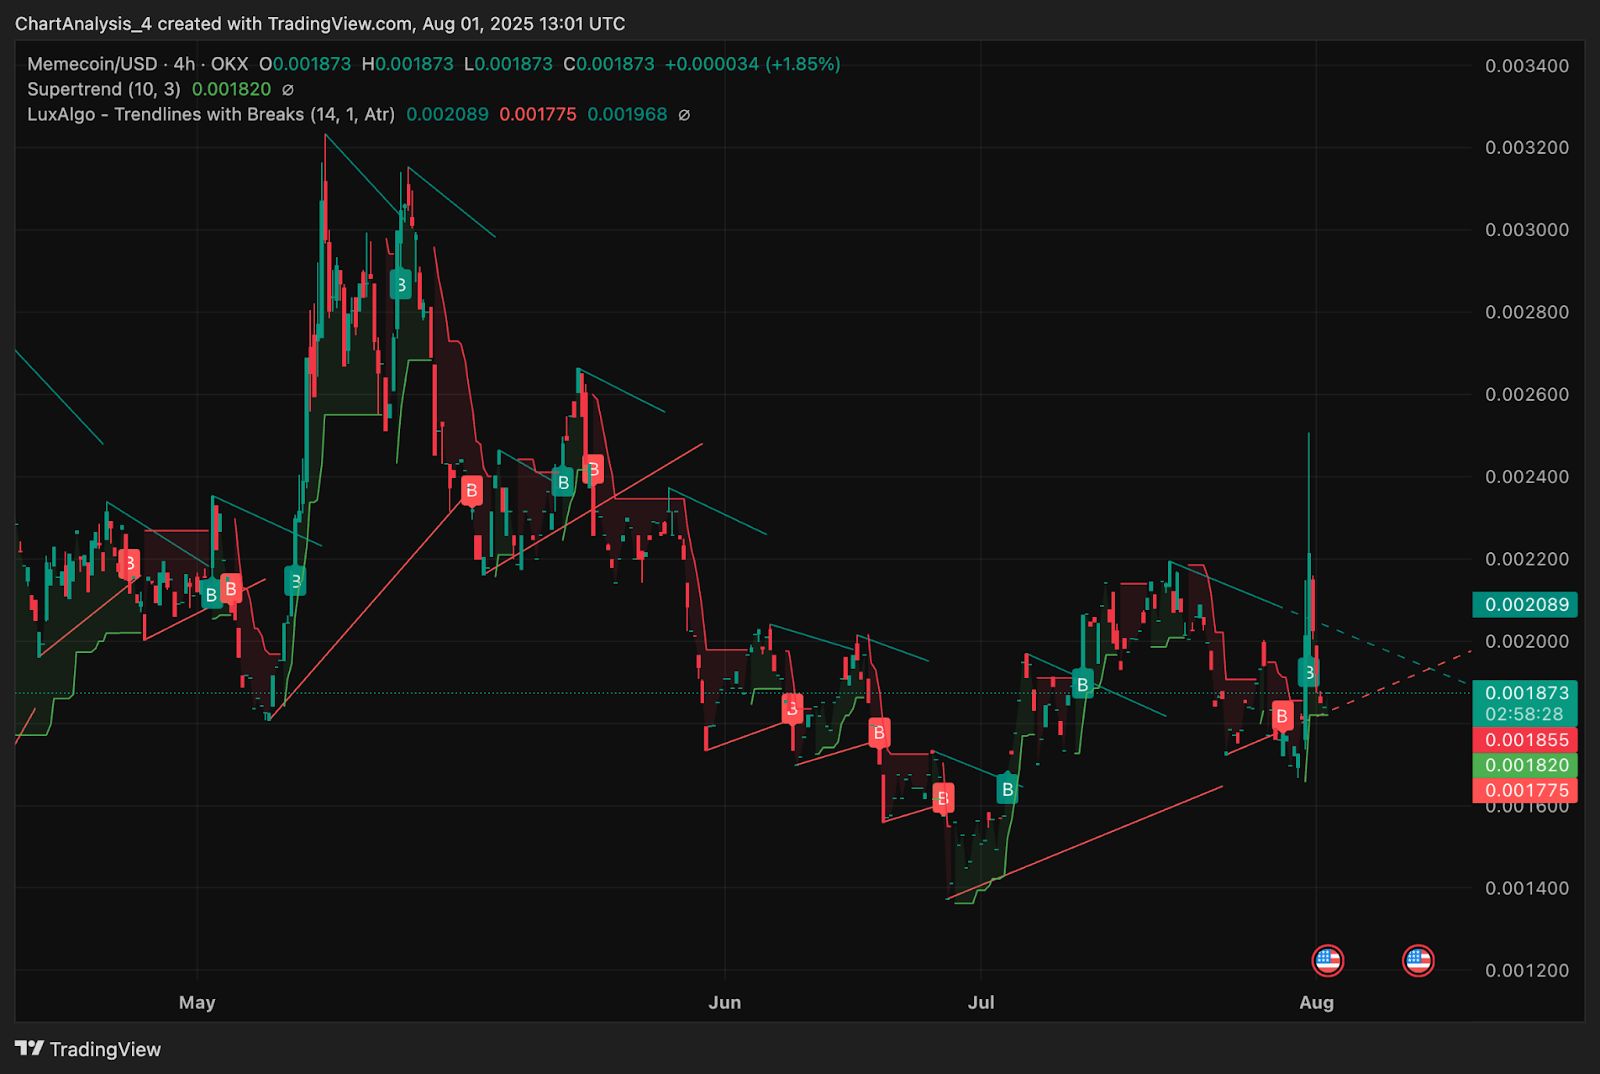
On the 4-hour chart, the Supertrend has triggered a buy signal following the breakout above the minor consolidation wedge near $0.00182. The LuxAlgo trendline breaks show a sharp rejection from $0.00250 followed by a retest of the $0.00177–$0.00185 pivot zone.
Holding this zone could be critical for price continuation through Q4 2025. If this base remains intact, short-term targets could realign with the April high of $0.00260.
Memecoin (MEME) Price Targets 2025–2030
| Year | Potential Low ($) | Potential Average ($) | Potential High ($) |
| 2025 | 0.00136 | 0.00192 | 0.00260 |
| 2026 | 0.00130 | 0.00215 | 0.00310 |
| 2027 | 0.00165 | 0.00240 | 0.00385 |
| 2028 | 0.00200 | 0.00285 | 0.00450 |
| 2029 | 0.00240 | 0.00340 | 0.00520 |
| 2030 | 0.00290 | 0.00395 | 0.00600 |
Memecoin (MEME) Price Prediction 2026
By 2026, MEME could benefit from continued base-building and clearer trend structure. If the $0.0020–$0.0022 zone flips into strong support, price could expand toward $0.0031. However, broader altcoin sentiment and memecoin hype cycles will influence long-term sustainability.
Memecoin (MEME) Price Prediction 2027
The year 2027 may witness trend maturity and potential pattern breakouts. If higher lows continue to form above $0.00165, MEME may push toward $0.00385. Market stability and alt-season rotation could drive higher volatility and volume across microcaps like MEME.
Memecoin (MEME) Price Prediction 2028
Should Memecoin continue to evolve as part of a broader niche ecosystem or regain social media traction, 2028 might see a rise toward the $0.00450 range. Institutional participation in memecoins could add a speculative premium to legacy tokens that survive multiple cycles.
Memecoin (MEME) Price Prediction 2029
In 2029, a new market cycle could position MEME to test its macro range highs if the asset remains listed and sufficiently liquid. Assuming broader crypto expansion, price could revisit the $0.0052 region while maintaining a floor above $0.0024.
Memecoin (MEME) Price Prediction 2030
By 2030, Memecoin’s trajectory will depend on its relevance within a maturing market. If community-driven tokens maintain a cultural role, MEME could challenge $0.00600 as a speculative long-tail asset. Average levels near $0.00395 may reflect the token’s standing within the memecoin hierarchy.
Conclusion
Memecoin’s outlook remains speculative but technically promising as it attempts a trendline breakout after a prolonged consolidation phase. With support now forming near $0.00136 and bullish indicators aligning across multiple timeframes, MEME could witness a staged recovery through 2025 and beyond. While volatility is expected, reclaiming and holding above the $0.00185–$0.00205 cluster would be essential to validate this trajectory. The coming years will likely test whether MEME remains a temporary speculative token or evolves into a cycle-resilient asset.





