Bitcoin is currently trading within an 18-day range between $115,000 and $121,000, with data indicating an imminent range expansion. Despite recent dips below $116,000, market liquidity dynamics and regulatory policy signals suggest a significant breakout is forthcoming.
-
Bitcoin maintains its 18-day trading range despite a breakdown below $116,000, signaling market indecision.
-
US regulatory policies under the Trump administration have created latency effects, influencing Bitcoin price movements and trader sentiment.
-
Expert analysis highlights increased Bitcoin treasury purchases and ETF inflows as bullish indicators amid short-term price volatility.
Bitcoin remains range-bound with breakout potential; explore key market signals and policy impacts shaping crypto’s near-term outlook.
-
Bitcoin’s recent price action reflects a complex interplay of market liquidity and regulatory influences, with the cryptocurrency trading within a tight range despite volatility.
-
Following the Federal Reserve’s FOMC minutes and Chair Jerome Powell’s statements, Bitcoin experienced a sharp sell-off but quickly rebounded as investors refocused on longer-term fundamentals.
-
COINOTAG sources report that despite short-term price pressures, institutional interest remains strong, supported by increasing treasury purchases and ETF inflows.
Bitcoin’s price remains range-bound amid regulatory and liquidity factors; institutional buying signals potential for breakout. Stay informed with COINOTAG.
Bitcoin Price Compression and Market Liquidity Signal Imminent Range Expansion
Bitcoin’s price compression within the $115,000 to $121,000 range over the past 18 days indicates a market poised for a breakout. Despite a breakdown below $116,000, BTC’s trading range remains intact, reflecting a balance between buyers and sellers. Analysts from Hyblock Capital describe recent price action as a liquidity hunt, with key metrics such as the bid-ask ratio at 10% orderbook depth turning red, increasing the likelihood of price testing liquidation levels near $115,883.
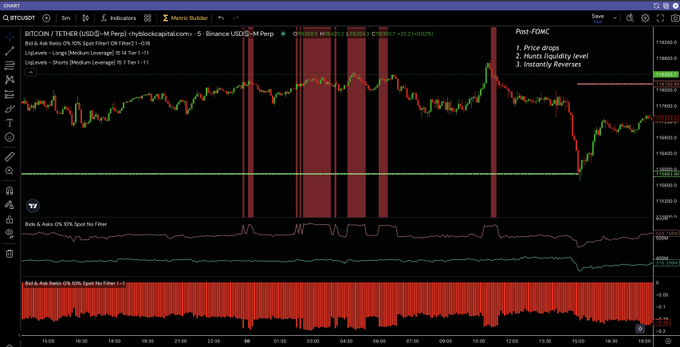
BTC/USDT after FOMC minutes. Source: X / Hyblock
Liquidation heat maps from Binance and Bybit show accelerated short liquidations above $120,000 and long liquidation risks below $115,000, underscoring the tight price corridor. Aggregate orderbook data reveals thickening sell walls at $121,100 and strong bids near $111,000, suggesting these levels as critical support and resistance zones.
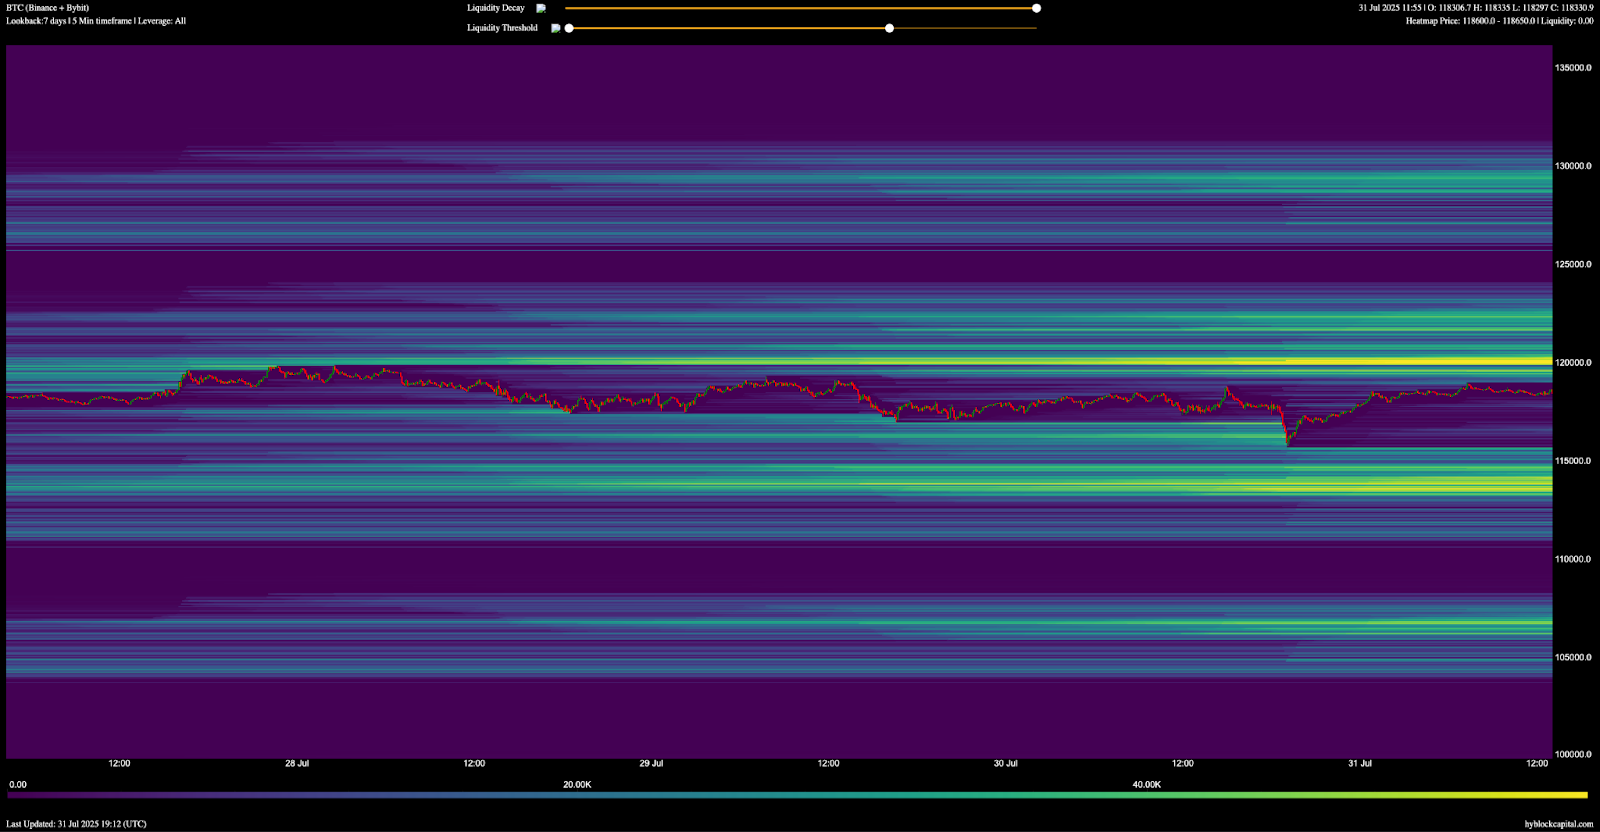
BTC/USDT liquidation heatmap. Source: Hyblock
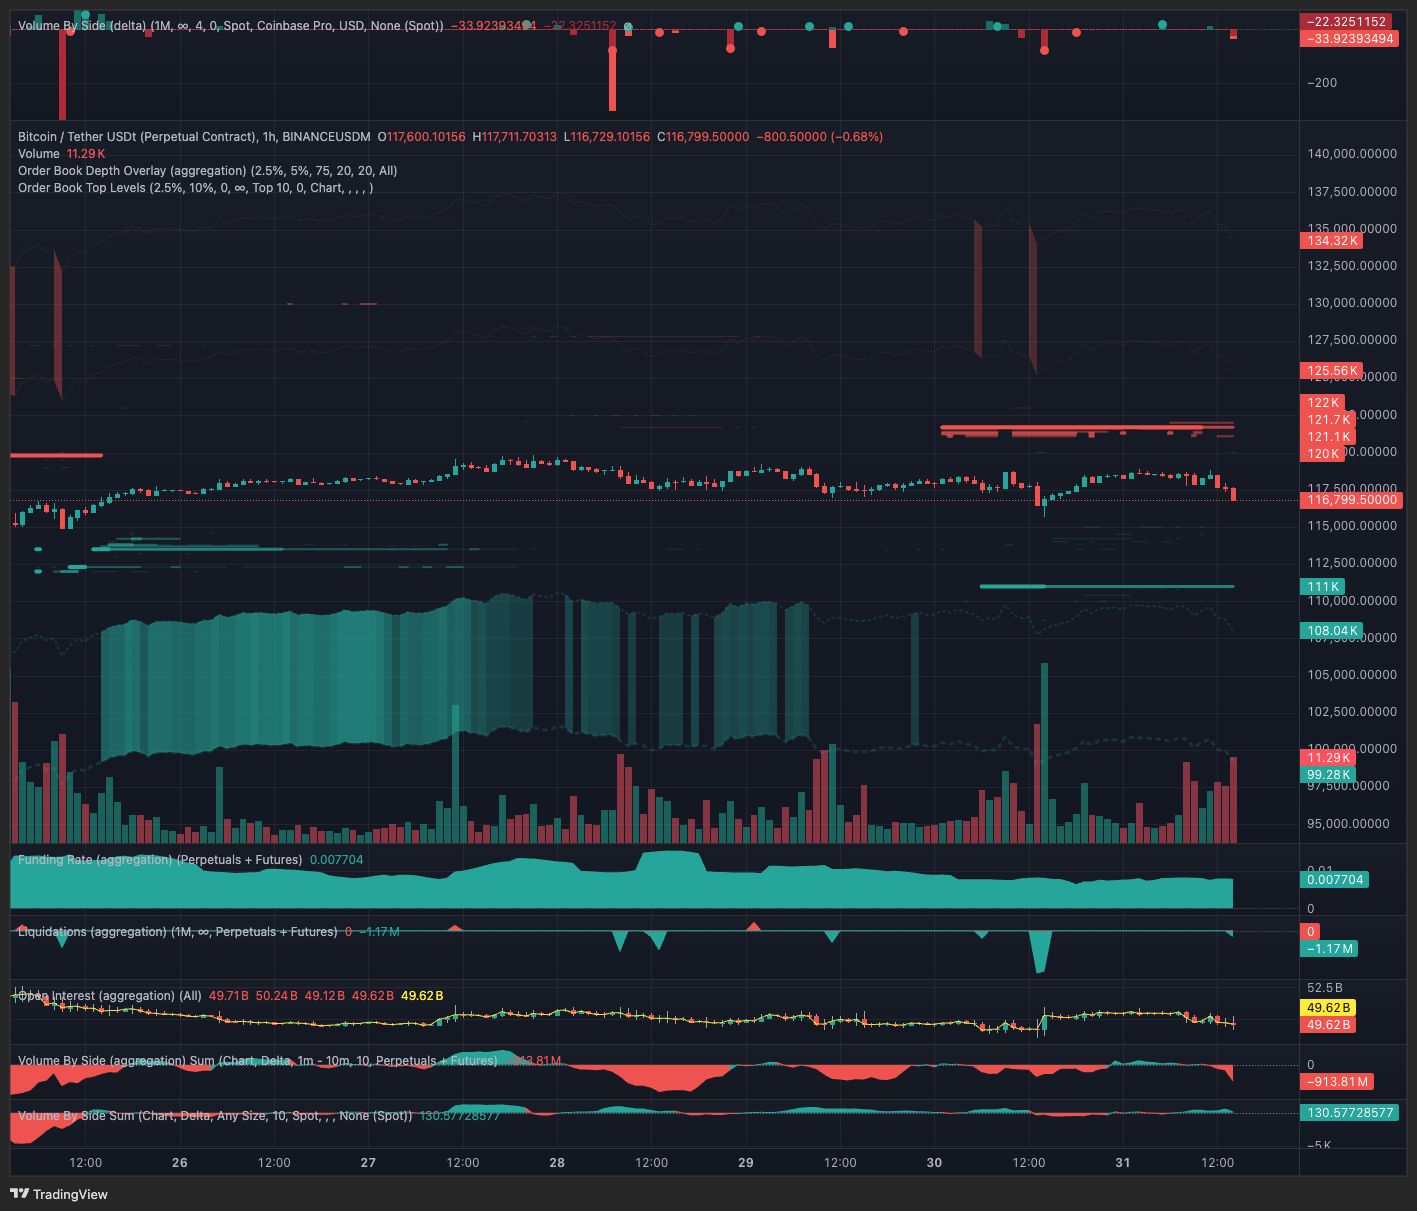
BTC/USDT 1-hour chart, Binance. Source: TRDR.io
How Are Institutional Treasury Purchases Influencing Bitcoin’s Price Stability?
Institutional treasury buying has surged, with Capriole Investments founder Charles Edwards noting that over the past six weeks, more than three companies have purchased Bitcoin daily. His treasury buys-to-sells ratio currently stands at an impressive 100:1 monthly, signaling strong institutional accumulation. This buying behavior provides a bullish foundation amid short-term price fluctuations and supports the potential for a sustained breakout.
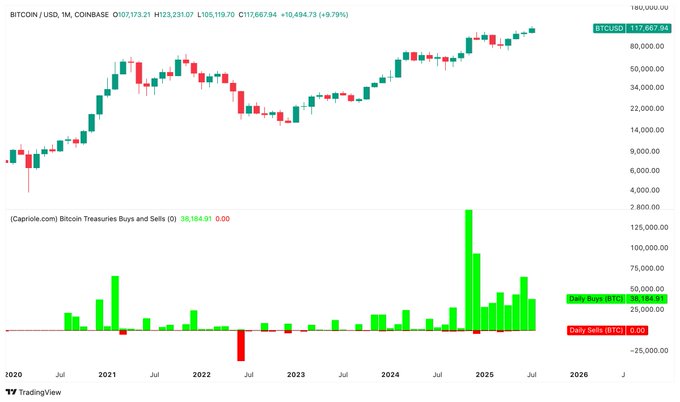
Bitcoin treasury buyers vs. sellers. Source: Charles Edwards / X
Spot Bitcoin ETFs have resumed inflows totaling $641.3 million since July 23, reversing last week’s $285 million outflows. These inflows reflect renewed investor confidence despite recent price volatility, further reinforcing Bitcoin’s underlying demand.
What Role Do US Regulatory Policies Play in Bitcoin’s Market Dynamics?
The Trump administration’s pro-crypto stance, outlined in recent White House reports and speeches by SEC chairman Paul S. Atkins, sets a clear policy framework prioritizing cryptocurrency sector growth. While immediate price impacts are muted, these regulatory signals provide institutional investors with confidence to increase Bitcoin allocations, fostering broader adoption and market stability.

Bitcoin sells off after FOMC. Source: Cointelegraph Markets / X
Short-term price action may continue to test support levels between $111,000 and $115,000 as sellers absorb long liquidity. Bulls aim for a strong bid at $111,000 to trigger volume spikes and reclaim the $116,000 range. A decisive daily close above $120,000, supported by positive spot and perpetual futures cumulative volume delta (CVD), would confirm a bullish breakout.
| $115,000 – $121,000 | Trading Range | Current Bitcoin price consolidation zone |
| $111,000 | Strong Bid | Key support level for potential rebound |
| $120,000 | Resistance | Critical breakout level for bulls |
Frequently Asked Questions
What factors contribute to Bitcoin’s price stability despite recent volatility?
Bitcoin’s price stability is supported by strong institutional buying, ETF inflows, and regulatory clarity, which together create a foundation for sustained market confidence.
Why is Bitcoin expected to break out of its current range soon?
Market indicators such as narrowing Bollinger Bands, liquidity hunts, and orderbook data suggest that Bitcoin is poised for a significant price movement beyond its current range.
Key Takeaways
- Bitcoin remains range-bound: Trading between $115,000 and $121,000 with signs of imminent breakout.
- Institutional demand is strong: Treasury purchases and ETF inflows support price stability.
- Regulatory clarity boosts confidence: US policy frameworks encourage broader adoption and investment.
Conclusion
Bitcoin’s current trading range reflects a market balancing act influenced by liquidity and regulatory factors.