
Solana Becomes The Talk Of Social Media As Price Hits $200

Solana (SOL) has crossed the $200 mark for the first time in months, sparking a frenzy of discussion across major social media platforms.
Solana Social Dominance Has Spiked To Highest Since Early June
In a new post on X, analytics firm Santiment has talked about how the crowd has reacted to the latest rally in Solana’s price. The metric of relevance here is the “Social Dominance,” which tells us about the degree of attention that a given coin is receiving on social media relative to the top 100 cryptocurrencies by market cap.
The indicator is based on another, known as the Social Volume. The Social Volume measures the unique number of posts/messages/threads on these platforms that are making mentions of the asset.
The Social Dominance takes the Social Volume of a coin and calculates what percentage of the combined Social Volume of the hundred largest assets in the sector that it makes up for.
Below is the chart shared by Santiment that shows the trend in the indicator for Solana over the last few months: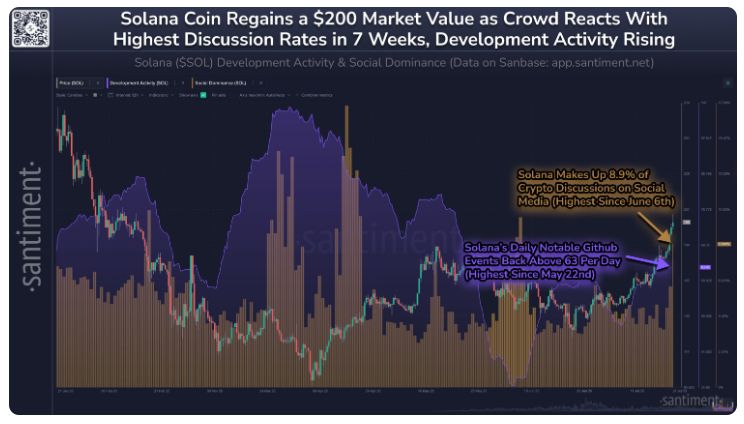
As displayed in the above graph, the Solana Social Dominance has just witnessed a sharp increase, indicating that interest in the asset has surged among social media users. The spike in attention toward SOL has come following a notable rally in its price, which has taken it past the $200 level for the first time since early 2025. The asset now makes up for 8.9% of all cryptocurrency-related discussions, the highest since June 6th.
Though while some market interest can be positive, an excess of it has generally proven to be a bearish sign in the past. As such, the spike in the Social Dominance of the coin may be something to keep an eye on, as FOMO developing among the crowd could potentially impede the price run.
In the same chart, the analytics firm has also attached the data for another Solana indicator: Development Activity. This metric measures, as its name suggests, the total amount of work that the developers of the project are putting in on its public GitHub repositories.
The indicator gauges development work in terms of ‘events,’ where an event is any action made by the developer on the repository, like the push of a commit or the creation of a fork.
From the graph, it’s visible that the Development Activity of Solana has witnessed a rise recently and has climbed back above 63 events per day. This is the highest value for the metric since May 22nd. Thus, it would appear that the developers of the project are ramping up their effort alongside the price surge.
SOL Price
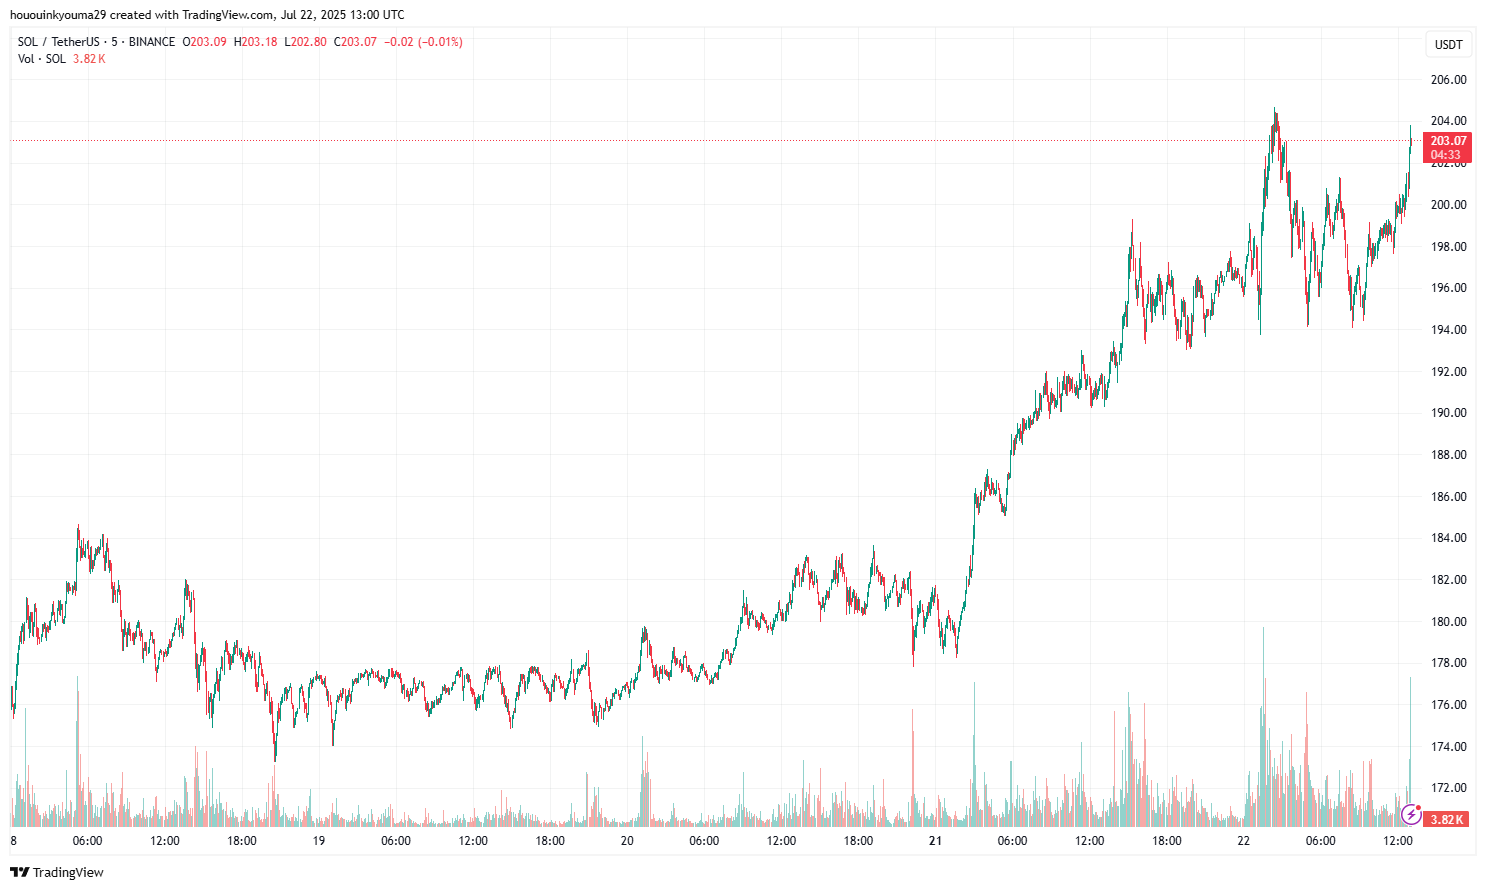
At the time of writing, Solana is floating around $203, up more than 27% in the last seven days.
Disclaimer: The content of this article solely reflects the author's opinion and does not represent the platform in any capacity. This article is not intended to serve as a reference for making investment decisions.
You may also like
Wall Street tech mogul Dan Ives: SpaceX (SPCX.US) shares have a 20%-25% "political discount"; merger with Tesla (TSLA.US) still possible
Dan Ives believes that SpaceX's stock currently has a "political discount" of 20% to 25%. At the same time, he still expects SpaceX to merge with Tesla, but this deal will face more obstacles.
J.P. Morgan: With Three Tailwinds, Emerging Market Rally Expands from AI Heavyweights to Non-Tech Sectors
JPMorgan released a research report stating that the rally in emerging markets has expanded from a few AI-weighted stocks to the non-tech sectors of EM.
AI stocks fuel global market rally, Nasdaq 100 futures jump 1.5%

Rising expectations of Fed rate hikes trigger a wave of US Treasury sell-offs! Japanese bonds follow suit, 10-year yields approach 2.8%
Due to the higher-than-expected US October CPI data, the market increased its bets that the Federal Reserve may need to take more aggressive rate hikes. US Treasury bonds were sold off on Tuesday, and Japanese government bonds followed the overnight decline in the US Treasury market on Wednesday.
Crypto prices
More


