Date: Sat, July 19, 2025 | 10:27 AM GMT
The cryptocurrency market is experiencing a mild weekend cooldown after a strong week of gains, with Ethereum (ETH) leading the broader uptrend — up 19% over the past week and trading near $3,550. This bullish momentum is spilling over into major altcoins , including Polygon (POL), which is showing signs of further upside.
POL has gained 23% over the past 30 days, and beyond this steady rise, a Bearish Gartley harmonic pattern forming on its daily chart suggests there could be more upside before any meaningful reversal.
 Source: Coinmarketcap
Harmonic Pattern Hints at Upside Continuation
On the daily timeframe, POL is tracing out a textbook Bearish Gartley harmonic pattern, often seen as a signal for a continuation rally before eventually hitting a reversal zone.
The pattern begins at point X near $0.3342, drops to point A, rebounds to point B, and extends to point C near $0.1636. Since then, POL has staged a sharp rebound and is currently trading near $0.2367, comfortably holding above its 100-day moving average ($0.2139), which has now turned into a key support.
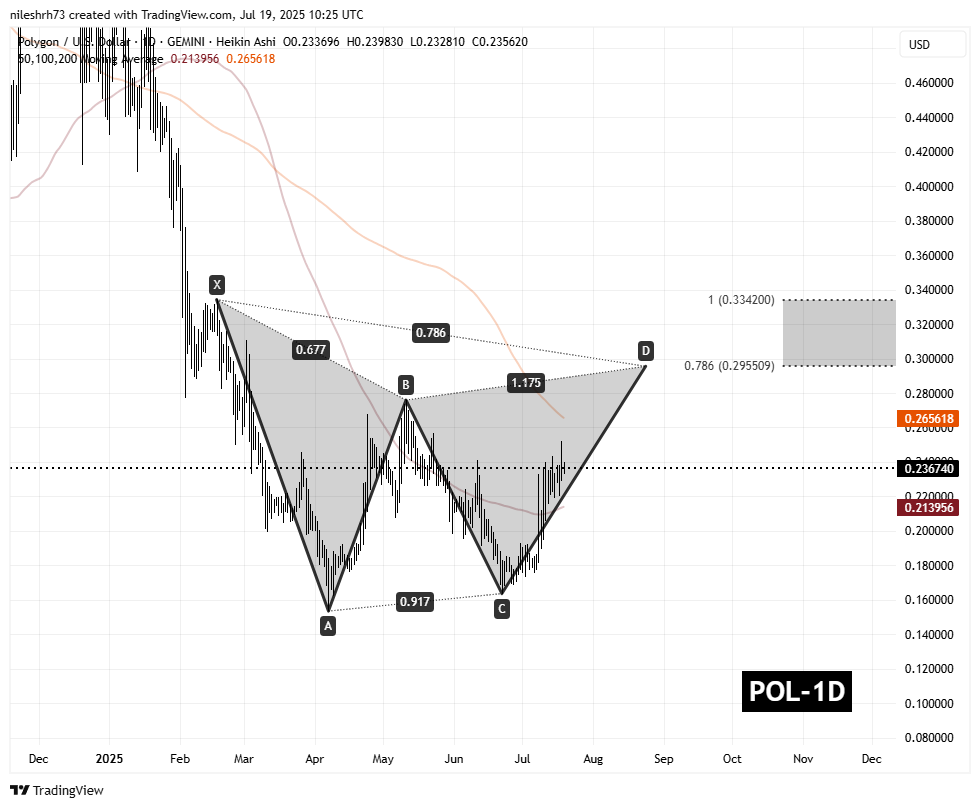 Polygon (POL) Daily Chart/Coinsprobe (Source: Tradingview)
The next challenge lies at the 200-day moving average ($0.2656) — a major resistance level that has capped rallies in the past.
What’s Next for POL?
If POL breaks above the 200-day MA with strong volume, the token could rally toward the Potential Reversal Zone (PRZ), which spans from $0.2955 to $0.3342. These targets align with the 0.786 and 1.0 Fibonacci extensions, which typically mark the completion of Bearish Gartley structures. From current levels, this implies a potential 40% upside.
However, if POL fails to reclaim the 200-day MA, a pullback toward the 100-day MA ($0.2139) could follow before another breakout attempt. For bulls, holding above $0.2139 remains critical to sustain momentum during this harmonic completion phase.