Stellar (XLM) delivered an impressive rally this month ahead of the broader altcoin hype, but veteran trader Peter Brandt believes XLM could be the biggest winner of this bull run.
“Potentially the most bullish chart of all belongs to $XLM,” Brandt wrote in his X post.
Sponsored
However, he stresses that two critical conditions must be met for this thesis to play out.
According to Brandt, Stellar must hold above its April low of $0.203 and secure a decisive close above $1.00. If it fails either test, XLM will remain stuck in its current trading range.
The April low represents the floor of XLM’s range‑bound action. A drop below $0.203 would shatter that support, likely triggering a deeper sell‑off and invalidating the bullish setup.
Conversely, a firm daily close above $1.00 would flip long‑standing resistance into support and activate the bullish continuation patterns.
Stellar (XLM) Forms Higher Lows and Ascending Triangle
Brandt also notes that XLM’s chart forms an ascending triangle, one of the most reliable bullish continuation patterns.
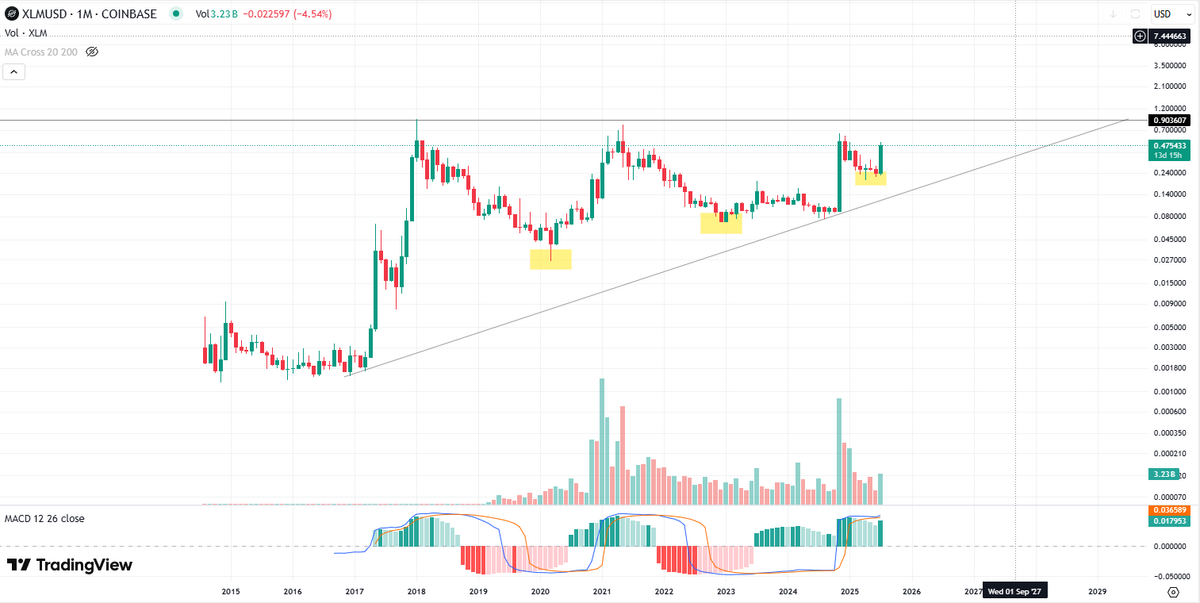 Stellar (XLM) price is forming an ascending triangle pattern and higher lows. Source: TradingView
Since 2020, each pullback in XLM has found support at successively higher prices, while a flat ceiling has repeatedly capped rallies.
Repeated tests of the same resistance tend to exhaust sellers, increasing the likelihood of an upside breakout once that level is finally breached.
Cup‑and‑Handle Reinforcement
Peter Brands also notes that on a longer timeframe, Stellar’s (XLM) price action forms a classic cup‑and‑handle pattern.
The “cup” is the rounded U‑shape swing from the 2021 peak down to the 2022 lows near $0.07 and back up toward $0.70, followed by the “handle,” a smaller consolidation dipping to around $0.20.
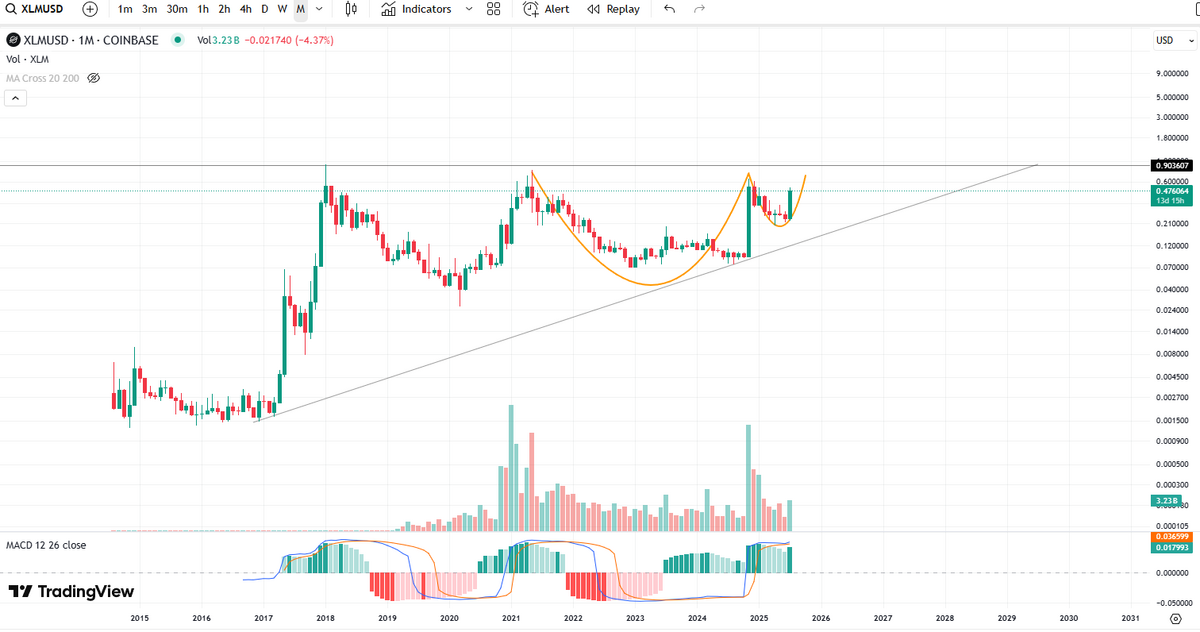 Stellar (XLM) price shows signs of “cup and handle” pattern formation. Source: TradingView
Once the handle’s resistance is breached, the pattern typically drives the price upward by about the cup’s depth, implying a target in the $2.00 area.
Why “Most Bullish” and Upside Potential
This convergence of two proven bullish patterns (ascending triangle and cup‑and‑handle) at the same barrier is rare. At XLM’s current $0.48 level, there is over 100% upside just to re‑test $1.00, and roughly 300–400% potential to reach the $1.90–$2.00 targets implied by both patterns.
Dig into DailyCoin’s top crypto scoops:
U.S. Passes GENIUS Act, Crypto Markets Rally
SPX6900 (SPX) Flips FLOKI, Sets Sights On $2 Moonshot
People Also Ask:
Stellar is a blockchain-based platform designed to facilitate fast, low-cost cross-border payments using its native token, XLM.
No. Stellar and Ripple were both founded by Jed McCaleb and aim to improve cross-border payments, but they are separate projects with different target audiences—Stellar focuses more on individuals and developing markets, while Ripple targets banks and financial institutions.
XLM is used to pay transaction fees on the Stellar network and to facilitate currency conversions between different fiat and crypto assets.
That depends on your strategy. Some view XLM as a long-term play on global remittances and tokenized finance, while others trade it based on technical trends.
Technically, yes—based on chart patterns like the ascending triangle and cup‑and‑handle. However, actual performance depends on market conditions, volume, and broader altcoin sentiment.