
Dogecoin (DOGE) Struggles to Break Out—Can Rising Indicators Shift the Trend?

Dogecoin (DOGE) remains under bearish pressure, but momentum is building as technical indicators show the first signs of a trend reversal.
Dogecoin (DOGE) is struggling to regain traction. It has been down more than 5% over the past seven days and has traded below $0.25 since the end of February. Despite brief signs of momentum, technical indicators still reflect a bearish bias, with key resistance levels capping upside attempts.
The Ichimoku Cloud remains red, EMA lines are still bearish, and price action continues to hover below critical trend-confirmation zones. However, a sharp shift in BBTrend and improving momentum metrics suggest traders are watching closely for a potential breakout attempt.
Dogecoin Faces Resistance as Bearish Ichimoku Structure Persists
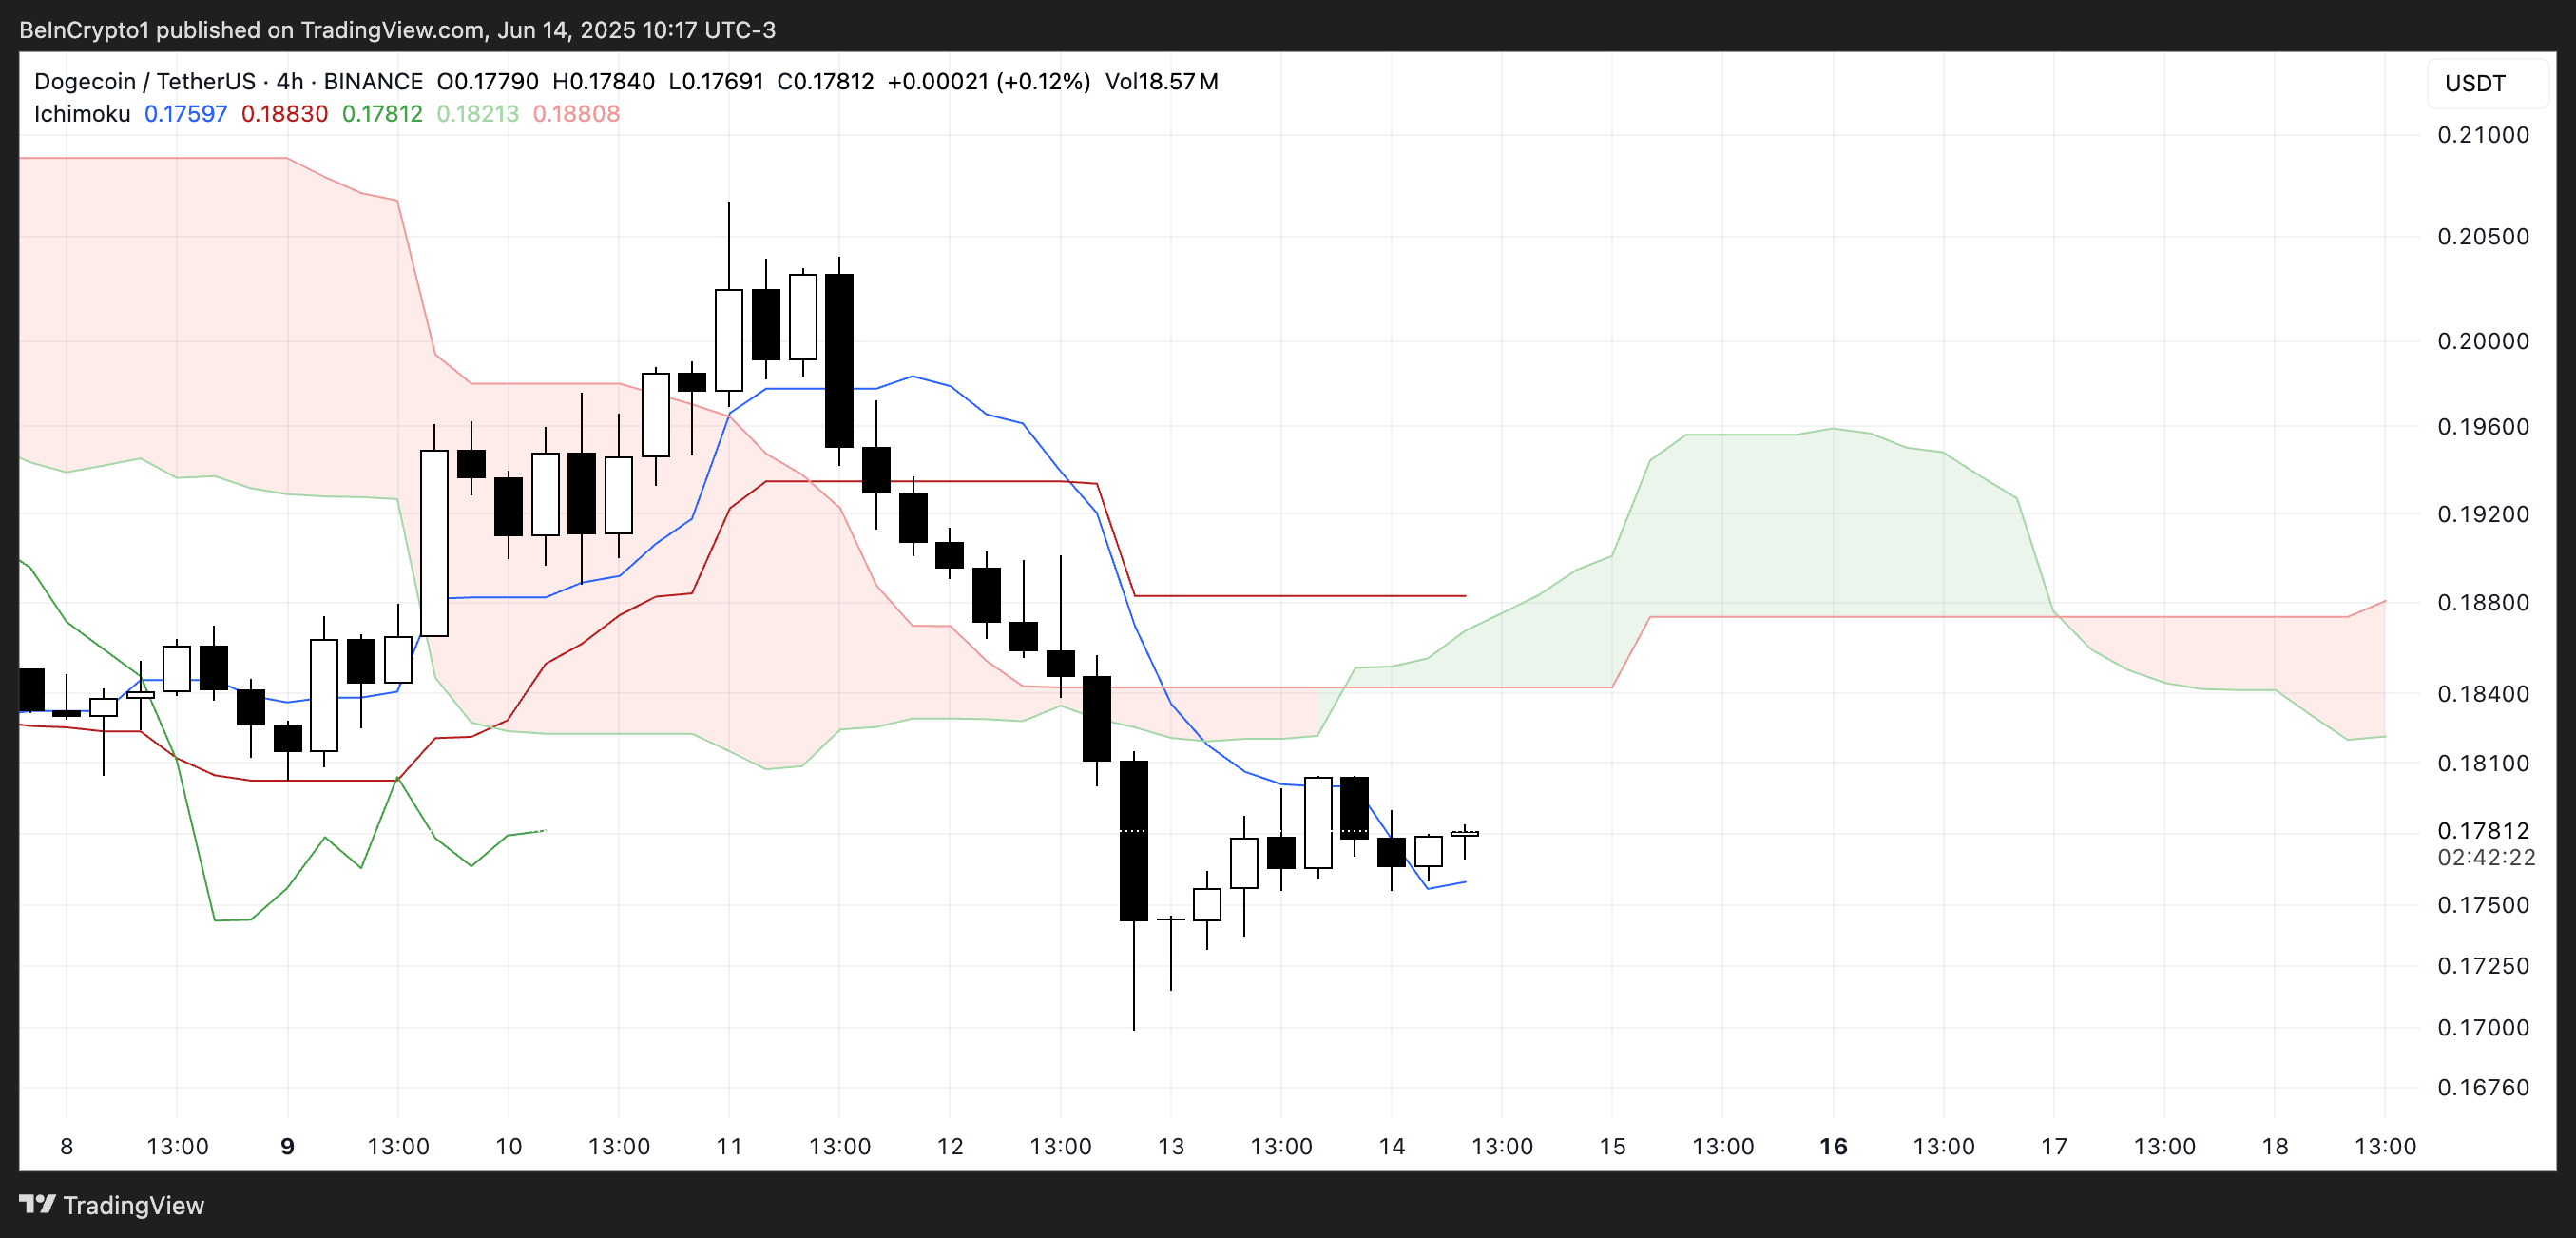
Dogecoin’s current Ichimoku Cloud chart shows a clear bearish structure, with price action remaining below the Kumo (cloud), which is shaded red in the near term.
The blue Tenkan-sen (conversion line) is positioned below the red Kijun-sen (base line), reinforcing a short-term bearish outlook.
Additionally, the price candles are struggling to break above the Tenkan-sen, which is acting as dynamic resistance and preventing upward momentum from building. This typically signals weak buying pressure in the current market phase.
 DOGE Ichimoku Cloud. Source:
TradingView.
Looking forward, the Kumo cloud ahead is transitioning from red to green, indicating a potential shift in sentiment if price manages to approach and penetrate the cloud.
However, the cloud itself is relatively thick, which suggests a strong resistance zone that will require significant bullish momentum to overcome. Until price enters or breaks above the cloud, the prevailing bias remains bearish.
The Kumo’s current flat base could also act as a magnet, drawing price toward it, but sustained upside will depend on whether Dogecoin can flip the cloud into support.
DOGE Sees Sharp Reversal as BBTrend Turns Positive
Dogecoin’s BBTrend indicator has flipped strongly bullish, rising to 2 from -3.14 just a day ago.
The BBTrend (Bollinger Band Trend) is a momentum indicator that measures the strength and direction of price movement relative to its Bollinger Bands.
Values above zero suggest bullish momentum, while values below zero signal bearish pressure. The higher the positive value, the stronger the upward momentum; likewise, deeper negative values indicate stronger downward trends.
 DOGE BBTrend. Source:
TradingView.
With DOGE’s BBTrend now at 2, it indicates a potential shift in sentiment and growing bullish momentum. This sharp reversal suggests that buying pressure is increasing and the asset may be entering a recovery phase.
While it doesn’t confirm a sustained uptrend on its own, a BBTrend in positive territory often precedes further gains—especially if supported by rising volume and follow-through in price action.
Traders may view this as an early signal to monitor for potential continuation.
DOGE Must Break $0.206 to Flip Trend—Or Risk Dropping to $0.168
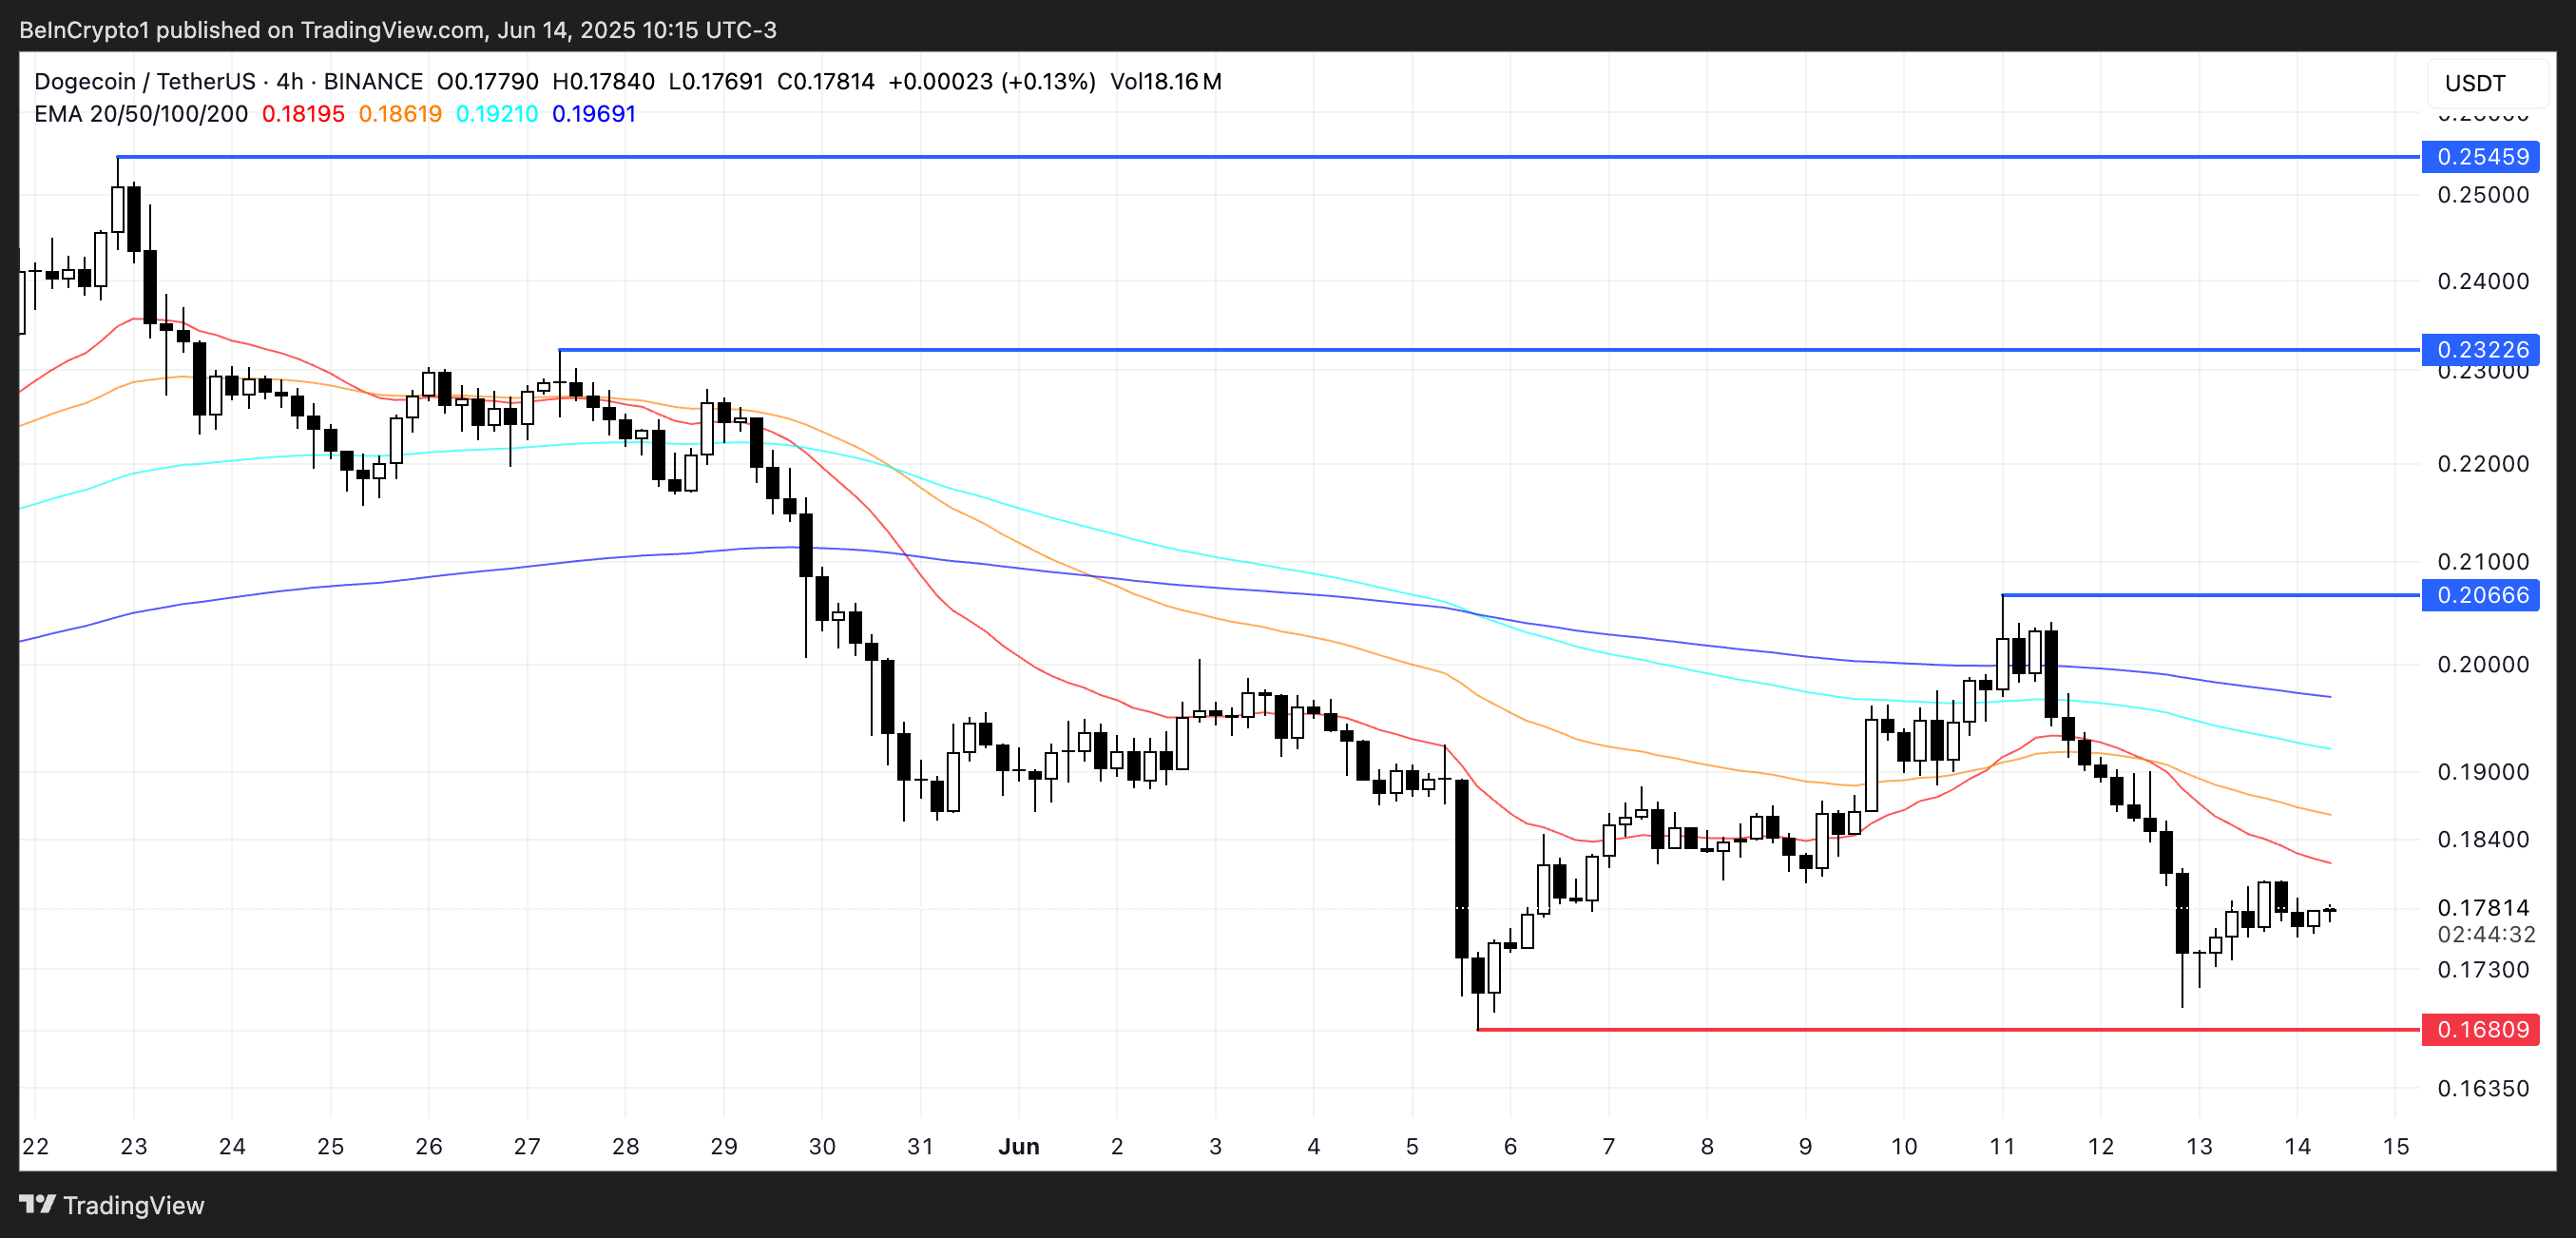
Dogecoin’s EMA lines remain in a bearish alignment, with short-term averages still below the long-term ones, reflecting ongoing downward pressure.
If the current bounce fails to gain strength, DOGE could soon retest support at $0.168, which has held in recent sessions. Without a decisive shift in momentum, this level may act as a magnet for price action in the near term.
 DOGE Price Analysis. Source:
TradingView.
The absence of an EMA crossover keeps the overall trend bearish for now.
On the flip side, if momentum strengthens and DOGE manages to break resistance at $0.206, it could trigger a broader reversal. In that case, the next upside targets would be $0.232 and potentially $0.254, assuming sustained follow-through.
Disclaimer: The content of this article solely reflects the author's opinion and does not represent the platform in any capacity. This article is not intended to serve as a reference for making investment decisions.
You may also like
Bank of Canada signals further interest rate hikes! Meeting minutes: High oil prices increase inflation risk, economic uncertainty will not hinder policy actions
The minutes of the Bank of Canada's October meeting reveal that, despite persistently high international oil prices and significant uncertainties in Canada's economic outlook caused by trade disputes with the United States, policymakers believe these risks do not mean the central bank must pause its actions.

Federal Reserve officials intensively deliver hawkish remarks! Waller calls for a 50 basis point rate hike in December, Bowman warns that AI investment returns may fall short of expectations, potentially triggering a sharp correction in US stocks
Several Federal Reserve officials issued consecutive hawkish signals on Tuesday, stating that inflationary pressures in the United States remain persistent and that monetary policy still needs to be further tightened.

Overnight US Stocks | Fed Rate Hike Expectations Rise, Major Indexes Fall, Nvidia (NVDA.US) Continues to Drop 5.4%
At the close, the Dow Jones Index fell by 156.67 points, down 0.30%, to 52,233.08 points; the S&P 500 Index dropped 28.99 points, down 0.38%, to 7,520.95 points; and the Nasdaq Composite Index declined 187.26 points, down 0.74%, to 25,065.87 points.
CoreWeave (CRWV.US) Q3 revenue surged 168% year-on-year, raised full-year revenue guidance, surged about 5% after hours
Benefiting from the continued growth in demand for AI computing power, CoreWeave's third-quarter revenue increased by 168% year-on-year, surpassing Wall Street expectations, and the company has raised its full-year revenue guidance.
Crypto prices
More


