
SOL Price Alert: Key Breakout Incoming

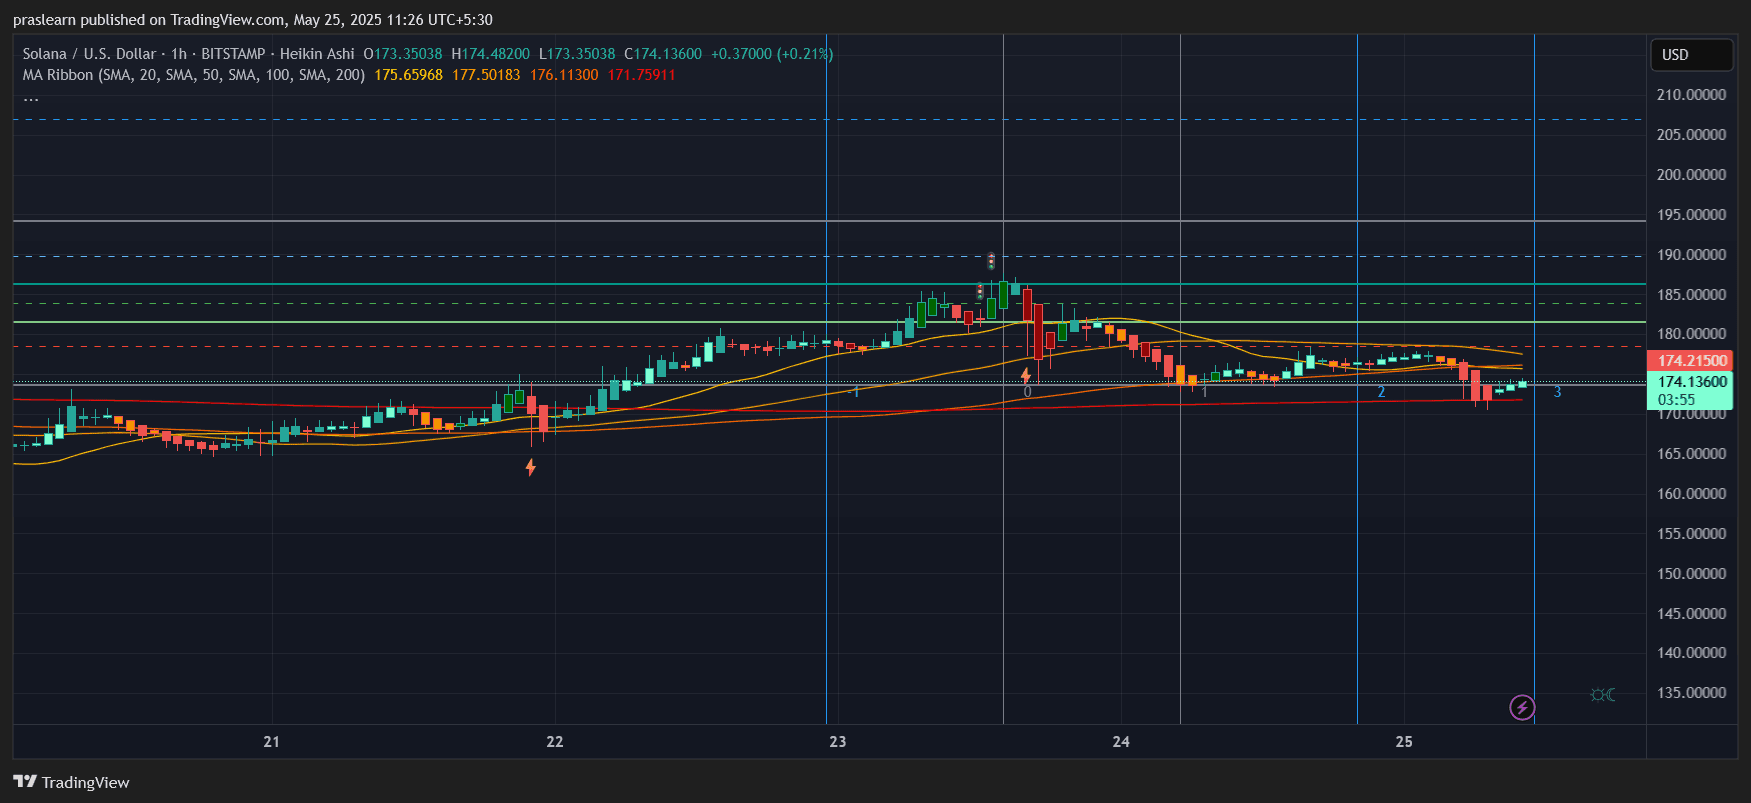
Solana price is currently trading around $174 , hovering slightly below its short-term resistance. The hourly chart shows that SOL recently dipped below its 50 and 100-period moving averages but is now attempting a recovery from the $171 zone, a crucial support area reinforced by the 200 SMA on the hourly timeframe.
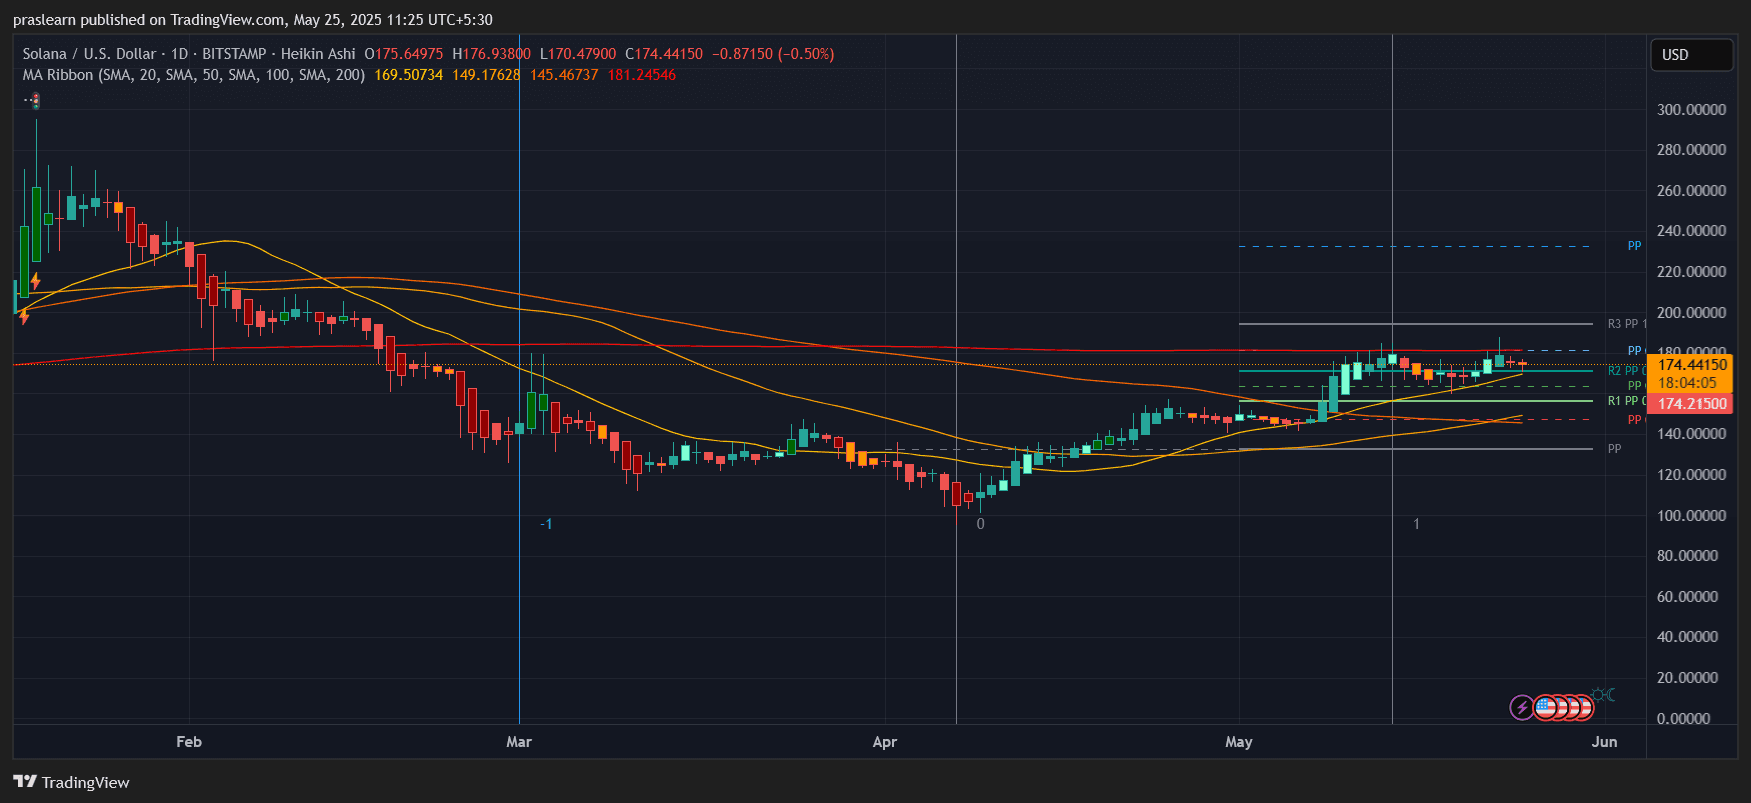
The daily chart reflects broader strength. After a prolonged downtrend earlier this year, Solana price has reclaimed major moving averages and is now consolidating just below the key psychological resistance level at $180, suggesting a brewing breakout.
Solana Price Prediction: Is SOL Price Building Strength for a Bigger Move?
 SOL/USD Daily Chart- TradingView
On the daily chart, SOL price has successfully broken above the 50-day SMA ($149) and 100-day SMA ($145), and is now confronting the 200-day SMA at $181. This long-term resistance level is critical — a confirmed breakout above this could fuel a sharp rally.
This setup resembles a classic bullish continuation after an accumulation phase between March and early May. The price has formed higher lows, and volume-supported green candles indicate smart money entering on dips.
Let’s validate the current momentum using simple calculations:
- From the local bottom at $118 (early April) to the recent high at $183, SOL gained around +55%.
- A Fibonacci extension (1.618 level) from this leg suggests a target of approximately $225, which matches the R3 pivot resistance visible on the chart.
If SOL price clears $181 (200-day SMA), it could quickly accelerate toward the $195-$200 zone, and then potentially $225 based on Fibonacci projections.
What Does the Hourly Chart Tell Us?
 SOL/USD 1 hr Chart- TradingView
The hourly chart indicates short-term caution. Solana price has been consolidating after a local high near $183, forming a mini head-and-shoulders pattern, followed by a dip below the 50 and 100 SMA lines, which now act as resistance.
But notably, the SOL price found support exactly at the 200 SMA (~$172) and is stabilizing with signs of a bounce. This level has held three times in the past 48 hours, forming a strong demand zone.
If buyers regain control and push above the $176-$178 band, SOL price could break back above intraday resistance, regaining bullish momentum. A move above $180 on hourly timeframe will confirm strength for a breakout attempt on the daily timeframe.
Solana Price Prediction: Will SOL Price Hit $200 Soon?
Technically, yes — if $181 is cleared with volume. Here’s the possible path:
- Break above $181 (200-day SMA and psychological barrier)
- Retest and hold above $180-$182 zone
- Rally toward $195, and if market-wide momentum supports, extend to $225 based on Fibonacci projection and previous pivot resistance
However, if $171 fails, Solana price may revisit $165 and potentially test $158, a previous accumulation zone.
Given the macro bullish structure and momentum in major altcoins, the odds currently favor a breakout.
Final Thoughts: Solana Price at a Crucial Decision Point
Solana price is approaching a pivotal moment . The daily chart structure is bullish, and historical patterns suggest a potential for another 20%-30% upside. However, short-term traders should watch the $171 support and $181 resistance levels closely.
If SOL price successfully flips $181 into support, we may soon witness the token charging toward $200 and beyond — and the next leg of the altcoin season may just be getting started.
Solana price is currently trading around $174 , hovering slightly below its short-term resistance. The hourly chart shows that SOL recently dipped below its 50 and 100-period moving averages but is now attempting a recovery from the $171 zone, a crucial support area reinforced by the 200 SMA on the hourly timeframe.
The daily chart reflects broader strength. After a prolonged downtrend earlier this year, Solana price has reclaimed major moving averages and is now consolidating just below the key psychological resistance level at $180, suggesting a brewing breakout.
Solana Price Prediction: Is SOL Price Building Strength for a Bigger Move?
SOL/USD Daily Chart- TradingView
On the daily chart, SOL price has successfully broken above the 50-day SMA ($149) and 100-day SMA ($145), and is now confronting the 200-day SMA at $181. This long-term resistance level is critical — a confirmed breakout above this could fuel a sharp rally.
This setup resembles a classic bullish continuation after an accumulation phase between March and early May. The price has formed higher lows, and volume-supported green candles indicate smart money entering on dips.
Let’s validate the current momentum using simple calculations:
- From the local bottom at $118 (early April) to the recent high at $183, SOL gained around +55%.
- A Fibonacci extension (1.618 level) from this leg suggests a target of approximately $225, which matches the R3 pivot resistance visible on the chart.
If SOL price clears $181 (200-day SMA), it could quickly accelerate toward the $195-$200 zone, and then potentially $225 based on Fibonacci projections.
What Does the Hourly Chart Tell Us?
SOL/USD 1 hr Chart- TradingView
The hourly chart indicates short-term caution. Solana price has been consolidating after a local high near $183, forming a mini head-and-shoulders pattern, followed by a dip below the 50 and 100 SMA lines, which now act as resistance.
But notably, the SOL price found support exactly at the 200 SMA (~$172) and is stabilizing with signs of a bounce. This level has held three times in the past 48 hours, forming a strong demand zone.
If buyers regain control and push above the $176-$178 band, SOL price could break back above intraday resistance, regaining bullish momentum. A move above $180 on hourly timeframe will confirm strength for a breakout attempt on the daily timeframe.
Solana Price Prediction: Will SOL Price Hit $200 Soon?
Technically, yes — if $181 is cleared with volume. Here’s the possible path:
- Break above $181 (200-day SMA and psychological barrier)
- Retest and hold above $180-$182 zone
- Rally toward $195, and if market-wide momentum supports, extend to $225 based on Fibonacci projection and previous pivot resistance
However, if $171 fails, Solana price may revisit $165 and potentially test $158, a previous accumulation zone.
Given the macro bullish structure and momentum in major altcoins, the odds currently favor a breakout.
Final Thoughts: Solana Price at a Crucial Decision Point
Solana price is approaching a pivotal moment . The daily chart structure is bullish, and historical patterns suggest a potential for another 20%-30% upside. However, short-term traders should watch the $171 support and $181 resistance levels closely.
If SOL price successfully flips $181 into support, we may soon witness the token charging toward $200 and beyond — and the next leg of the altcoin season may just be getting started.
Disclaimer: The content of this article solely reflects the author's opinion and does not represent the platform in any capacity. This article is not intended to serve as a reference for making investment decisions.
You may also like
US CPI Exceeds Expectations Again, Waller's Warning Comes True! Wall Street Focuses on Whether December Rate Hike Will Be 25 or 50 Basis Points; "New Fed News Agency": Stop-and-Go Strategy Faces Test
The "New Federal Reserve Newsletter" pointed out that before the release of the CPI, Waller suggested the possibility of a 50-basis-point rate hike in December, and so far, no other Fed officials have publicly responded. In addition to a single 50-basis-point hike, the Fed may also choose to signal consecutive rate hikes in December and January. Wall Street generally believes that inflationary pressures remain stubborn, further strengthening the case for a rate hike in December, though a 50-basis-point increase is not a consensus. The market is concerned about whether the Fed will extend the tightening cycle.
CPI Deals a Blow to US Bonds! 2-Year Yield Surges Over 20 Basis Points Intraday, Gold and Silver Plunge
After the release of the CPI, traders began to expect a lower likelihood of a 50 basis point rate hike in December; this year’s Federal Reserve voting member Logan stated that a faster pace of rate hikes may be needed this winter, with at least two more 25 basis point hikes required before pausing. Subsequently, the rise in U.S. Treasury yields continued to widen, with the 10-year yield climbing back above 5.0% and rising more than 10 basis points intraday; spot gold once fell over 3%, while spot silver at one point dropped more than 4%.
Historical Data Reveals When XRP Could Peak This Cycle
GUCCI’s parent company targets the traditional gold business
Crypto prices
More


