
Bitcoin Price Crash to $60,000? Here's What the Charts Say Now

Bitcoin (BTC) is currently dancing on a razor’s edge near $82,500, and traders are watching nervously. After a period of sideways consolidation, the crypto giant is showing early signs of weakness—raising the question: Is Bitcoin price preparing for a deep drop to $60,000 , or is this a bear trap before the next rally? Let’s dive into the daily and hourly charts to decode the truth behind BTC’s next major move.
Bitcoin Price Prediction: Is the Daily Chart Flashing Bearish Warnings?
 BTC/USD Daily Chart- TradingView
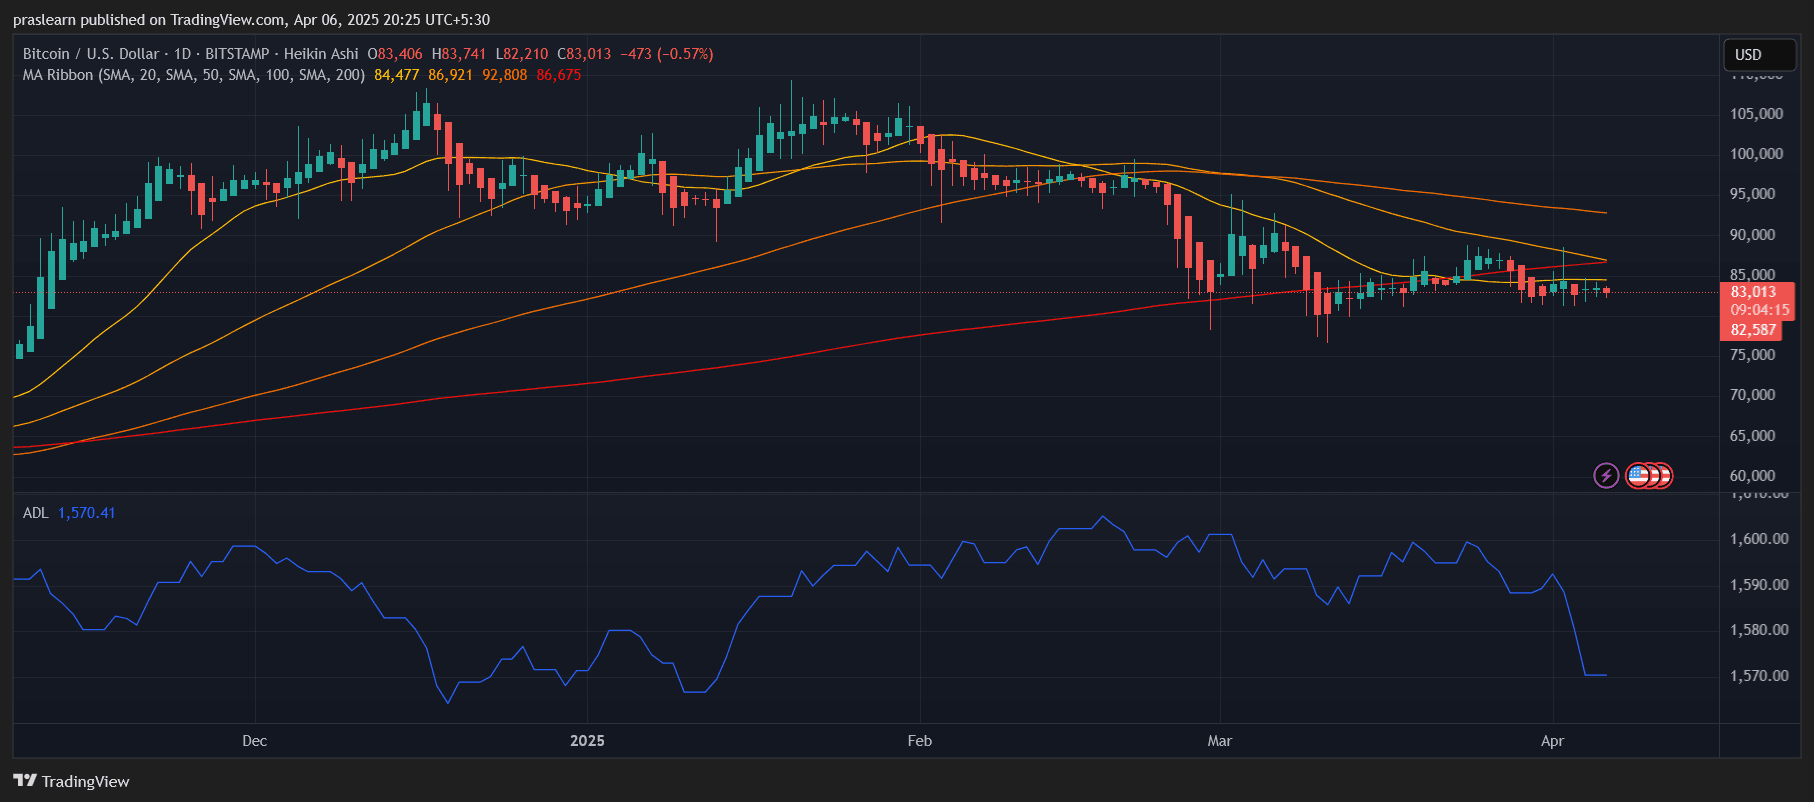
On the daily chart, Bitcoin continues to struggle below major resistance levels. The Heikin Ashi candles are small-bodied and red, signaling a lack of momentum and indecision in the market. Price action is firmly below all major moving averages—with the 20 SMA at $84,477, 50 SMA at $86,921, and 100 SMA at $92,808. This alignment indicates a clear bearish structure where each rally is being sold into.
What’s more concerning is that Bitcoin has failed multiple times to reclaim the 100-day SMA, indicating sustained selling pressure from institutions and swing traders. The presence of the 200 SMA below current price around $86,675 had acted as a temporary support in March, but it has now turned neutral as price hovers well below it.
The ADL (Accumulation/Distribution Line) has sharply dropped, confirming distribution over accumulation. This means that even during slight upward moves, smart money has been offloading, not adding to positions. Without a turn in the ADL, any bounce is suspect.
Bitcoin Crash: What Does the Hourly Chart Reveal About Short-Term Momentum?
 BTC/USD 1 hr chart- TradingView
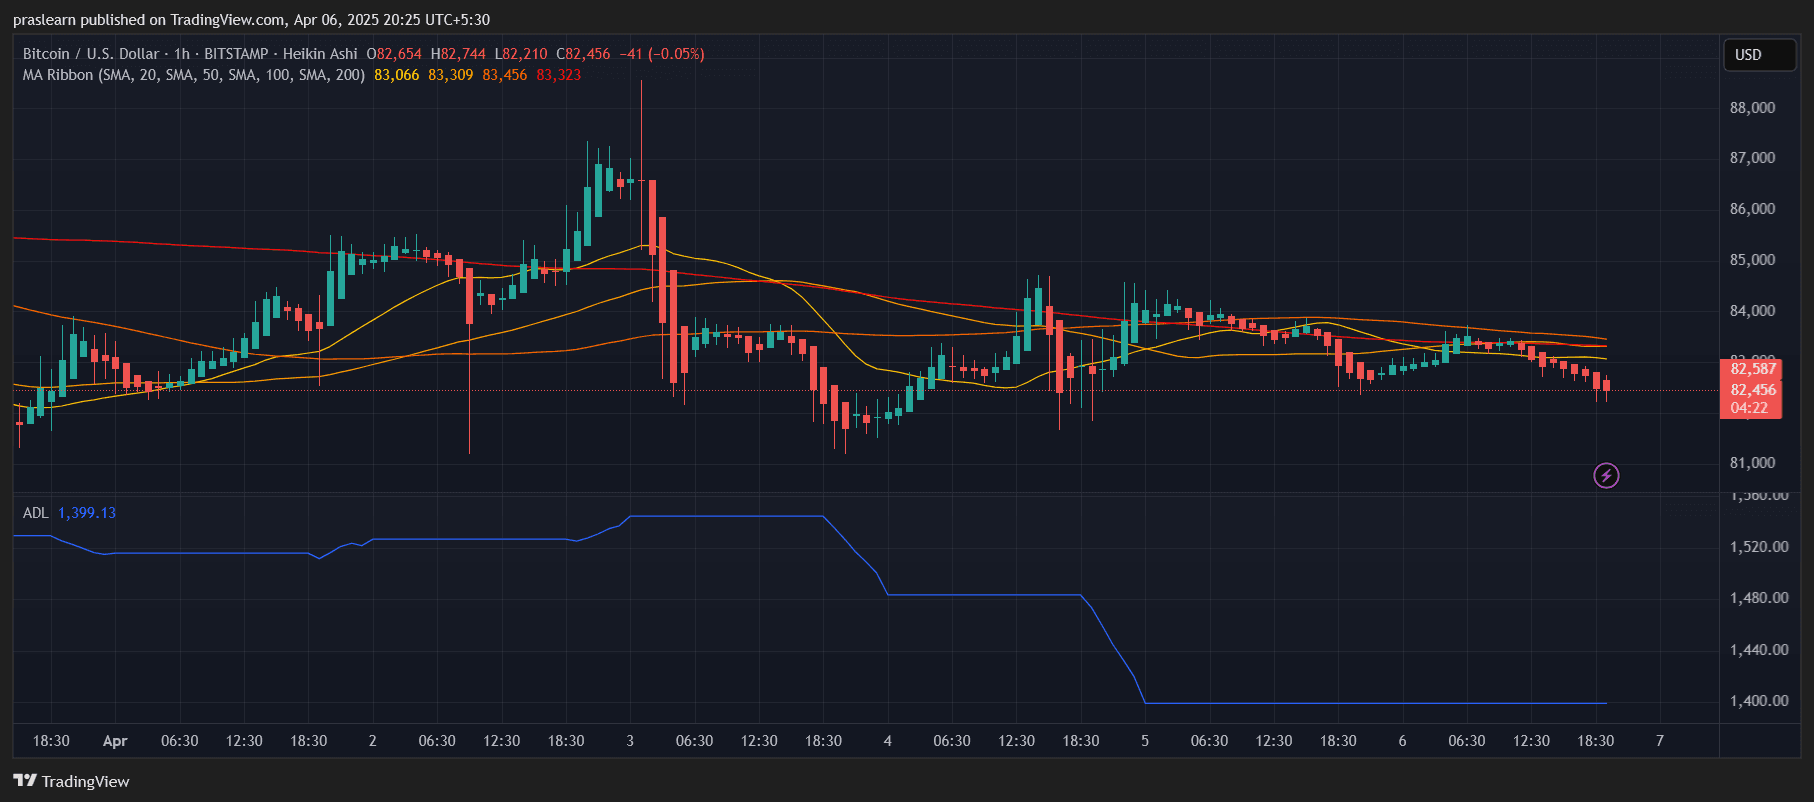
Zooming into the 1-hour chart, the picture becomes even more clear: Bitcoin is grinding downward in a slow, controlled bleed. After peaking briefly around $87K on April 2nd, BTC experienced sharp rejection and has since been forming lower highs. The recent attempt to climb was stopped cleanly at the 200 SMA near $83,300, confirming it as short-term resistance.
The moving averages on the hourly (20, 50, and 100 SMA) are compressing and curving downward, which typically leads to momentum breakdowns, especially when paired with flat volume and fading bullish candles. The most recent Heikin Ashi candles are small-bodied and leaning bearish, showing that the bulls are losing steam and failing to defend even intraday bounces.
The hourly ADL is declining, further confirming the lack of demand at current price levels. Retail interest appears low, and there’s no sign of whale-driven accumulation on this timeframe either.
Bitcoin Crash: Where Are Bitcoin’s Key Support and Resistance Levels?
Immediate support lies at $82,000, which has been tested several times over the past few sessions. A decisive break below this level could trigger a sharp selloff down to $78,500, with a psychological and structural support zone around $75,000. If that fails, then the long-feared move toward $69,000–$60,000 could come into play quickly.
On the upside, resistance sits heavy around $84,500, followed by $86,900, both marked by the daily 20 and 50 SMA zones. Only a break above $87,500–$88,000, backed by volume, would confirm a bullish reversal and negate the current bearish setup.
What Do the Indicators Suggest?
- Moving Averages: Across both timeframes, BTC price is trapped below all critical moving averages. This is a textbook sign of a sustained downtrend. The squeeze of shorter SMAs on the hourly suggests a potential spike in volatility soon—likely downward if support breaks.
- Heikin Ashi Candles: Candles are weak and indecisive across both daily and hourly charts. This indicates exhaustion and a lack of trend commitment from either bulls or bears, but in the current context, it's leaning bearish.
- ADL (Accumulation/Distribution Line): This is the clearest red flag. The sharp drop in the ADL on the daily chart suggests strong selling and no meaningful accumulation. Until this reverses, upside moves are likely to be short-lived.
Bitcoin Price Prediction: What’s Next for April?
Short-Term Outlook (Next 48–72 hours): If $82,000 fails, expect a fast drop to $78,000 or lower. If bulls hold the line and reclaim $84,500 with volume, we might see a short-term bounce to $87K.
Mid-Term Outlook (Next 1–2 weeks): Without a break above the 100-day SMA, Bitcoin price is at risk of cascading down to $75,000. Market sentiment is fragile, and macroeconomic news or ETF flows could tip the balance.
Long-Term Outlook (Rest of April 2025): If $75,000 breaks in April, then a full correction down to $60,000 is on the table. However, if bulls manage to regain $90K territory, it could open the door back to $100K.
Is a Bitcoin Crash Coming?
The charts are clear—Bitcoin price is at a critical level. The current structure favors bears, with no strong signs of reversal just yet. Accumulation is weak, momentum is fading, and major resistances are pushing BTC price lower. Unless bulls step in with force soon, a deep correction could be just around the corner.
So, is Bitcoin price heading for $60,000 or ready to bounce? For now, the trend says: Proceed with caution.
Bitcoin (BTC) is currently dancing on a razor’s edge near $82,500, and traders are watching nervously. After a period of sideways consolidation, the crypto giant is showing early signs of weakness—raising the question: Is Bitcoin price preparing for a deep drop to $60,000 , or is this a bear trap before the next rally? Let’s dive into the daily and hourly charts to decode the truth behind BTC’s next major move.
Bitcoin Price Prediction: Is the Daily Chart Flashing Bearish Warnings?
BTC/USD Daily Chart- TradingView
On the daily chart, Bitcoin continues to struggle below major resistance levels. The Heikin Ashi candles are small-bodied and red, signaling a lack of momentum and indecision in the market. Price action is firmly below all major moving averages—with the 20 SMA at $84,477, 50 SMA at $86,921, and 100 SMA at $92,808. This alignment indicates a clear bearish structure where each rally is being sold into.
What’s more concerning is that Bitcoin has failed multiple times to reclaim the 100-day SMA, indicating sustained selling pressure from institutions and swing traders. The presence of the 200 SMA below current price around $86,675 had acted as a temporary support in March, but it has now turned neutral as price hovers well below it.
The ADL (Accumulation/Distribution Line) has sharply dropped, confirming distribution over accumulation. This means that even during slight upward moves, smart money has been offloading, not adding to positions. Without a turn in the ADL, any bounce is suspect.
Bitcoin Crash: What Does the Hourly Chart Reveal About Short-Term Momentum?
BTC/USD 1 hr chart- TradingView
Zooming into the 1-hour chart, the picture becomes even more clear: Bitcoin is grinding downward in a slow, controlled bleed. After peaking briefly around $87K on April 2nd, BTC experienced sharp rejection and has since been forming lower highs. The recent attempt to climb was stopped cleanly at the 200 SMA near $83,300, confirming it as short-term resistance.
The moving averages on the hourly (20, 50, and 100 SMA) are compressing and curving downward, which typically leads to momentum breakdowns, especially when paired with flat volume and fading bullish candles. The most recent Heikin Ashi candles are small-bodied and leaning bearish, showing that the bulls are losing steam and failing to defend even intraday bounces.
The hourly ADL is declining, further confirming the lack of demand at current price levels. Retail interest appears low, and there’s no sign of whale-driven accumulation on this timeframe either.
Bitcoin Crash: Where Are Bitcoin’s Key Support and Resistance Levels?
Immediate support lies at $82,000, which has been tested several times over the past few sessions. A decisive break below this level could trigger a sharp selloff down to $78,500, with a psychological and structural support zone around $75,000. If that fails, then the long-feared move toward $69,000–$60,000 could come into play quickly.
On the upside, resistance sits heavy around $84,500, followed by $86,900, both marked by the daily 20 and 50 SMA zones. Only a break above $87,500–$88,000, backed by volume, would confirm a bullish reversal and negate the current bearish setup.
What Do the Indicators Suggest?
- Moving Averages: Across both timeframes, BTC price is trapped below all critical moving averages. This is a textbook sign of a sustained downtrend. The squeeze of shorter SMAs on the hourly suggests a potential spike in volatility soon—likely downward if support breaks.
- Heikin Ashi Candles: Candles are weak and indecisive across both daily and hourly charts. This indicates exhaustion and a lack of trend commitment from either bulls or bears, but in the current context, it's leaning bearish.
- ADL (Accumulation/Distribution Line): This is the clearest red flag. The sharp drop in the ADL on the daily chart suggests strong selling and no meaningful accumulation. Until this reverses, upside moves are likely to be short-lived.
Bitcoin Price Prediction: What’s Next for April?
Short-Term Outlook (Next 48–72 hours): If $82,000 fails, expect a fast drop to $78,000 or lower. If bulls hold the line and reclaim $84,500 with volume, we might see a short-term bounce to $87K.
Mid-Term Outlook (Next 1–2 weeks): Without a break above the 100-day SMA, Bitcoin price is at risk of cascading down to $75,000. Market sentiment is fragile, and macroeconomic news or ETF flows could tip the balance.
Long-Term Outlook (Rest of April 2025): If $75,000 breaks in April, then a full correction down to $60,000 is on the table. However, if bulls manage to regain $90K territory, it could open the door back to $100K.
Is a Bitcoin Crash Coming?
The charts are clear—Bitcoin price is at a critical level. The current structure favors bears, with no strong signs of reversal just yet. Accumulation is weak, momentum is fading, and major resistances are pushing BTC price lower. Unless bulls step in with force soon, a deep correction could be just around the corner.
So, is Bitcoin price heading for $60,000 or ready to bounce? For now, the trend says: Proceed with caution.
Disclaimer: The content of this article solely reflects the author's opinion and does not represent the platform in any capacity. This article is not intended to serve as a reference for making investment decisions.
You may also like
If Jensen Huang resigns, who could take over Nvidia? AMD's Lisa Su included in media candidates
AMD CEO Lisa Su, who holds a Ph.D. from MIT and led AMD back to growth while rebuilding customer trust during a crisis, is seen as a potential candidate. However, the competitive relationship between AMD and NVIDIA adds complexity to the succession process. Arm CEO Rene Haas, who worked at NVIDIA for seven years, is considered a smoother option for succession.

SoftBank reports first quarterly loss in two years! $3.7 billion impairment in US data center project, AI investments face pressure
SoftBank Group reported a net loss of 1.12 trillion yen in its second fiscal quarter, marking its first quarterly loss in nearly two years. The main reasons are the write-off of nearly $3.7 billion in advance payments due to adjustments in the procurement of power supply equipment for its AI data center in Ohio, USA, a shift of the Vision Fund from profit to loss, and a surge in the cost of high-debt financing. Since the June peak, SoftBank's share price has fallen more than 50%.
Expanding computing power on one hand, grabbing spectrum on the other! Barclays optimistic about SpaceX (SPCX.US) acquiring T-Mobile: Complementary advantages of ground networks and Starlink
After Space's stock price rose for two consecutive days, Barclays stated that T-Mobile is the "cleanest" choice among SpaceX’s potential acquisition targets. Barclays considers Verizon a major unknown, while AT&T has the lowest strategic fit.
Will the Federal Reserve raise rates in December? Tonight's CPI will be the final verdict!
The October CPI data will be released tonight, with the market pricing in an 86% chance of a rate hike. Goldman Sachs predicts a core CPI month-on-month increase of only 0.16%, much lower than market expectations. However, statistical distortions in health insurance and declines in used car prices—these "soft factors"—are unlikely to be reflected in the core PCE, which the Federal Reserve places greater emphasis on. The data may trigger a relief rally, but it is unlikely to change the underlying hawkish sentiment.

Crypto prices
More


