
Stellar (XLM) Dives 5% With Indicators Suggesting More Losses

Stellar faces sharp declines as bearish momentum builds, with technicals pointing to $0.22 and $0.20 as critical support levels. Momentum and capital outflows suggest deeper losses ahead unless bulls step in fast.
Stellar (XLM) is down more than 5% on Thursday, with its market capitalization dropping to $8 billion. XLM technical indicators are flashing strong bearish signals, suggesting continued downward momentum that could test critical support levels around $0.22.
While a reversal scenario remains possible with resistance targets at $0.27, $0.29, and $0.30, such an upside move would require a substantial shift in market sentiment.
XLM RSI Shows Sellers Are In Control
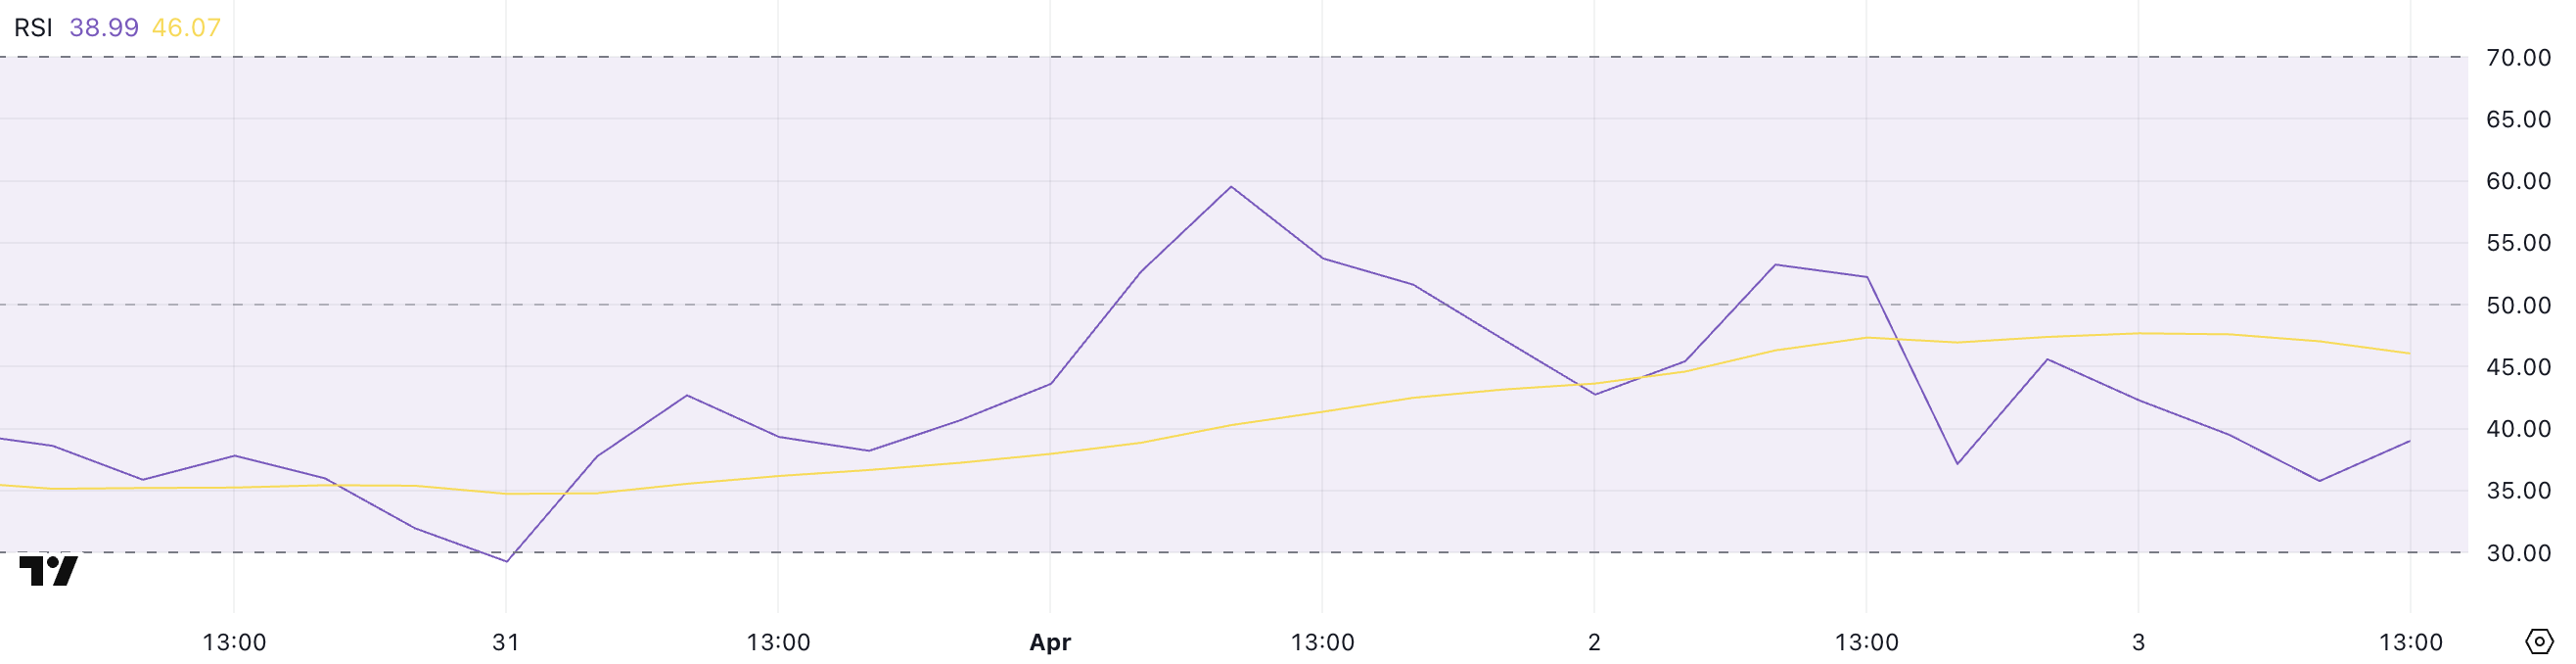
Stellar’s Relative Strength Index (RSI) has dropped sharply to 38.99, down from 59.54 just two days ago—signaling a notable shift in momentum.
The RSI is a widely used momentum oscillator that measures the speed and magnitude of recent price changes, typically ranging between 0 and 100.
Readings above 70 suggest overbought conditions, while levels below 30 indicate oversold territory. A reading between 30 and 50 often reflects bearish momentum but is not yet extreme enough to trigger an immediate reversal.
 XLM RSI. Source:
TradingView.
With Stellar’s RSI now below the key midpoint of 50 and approaching the oversold threshold, the current reading of 38.99 suggests that sellers are gaining control.
While it’s not yet in oversold territory, it does signal weakening buying pressure and increasing downside risk.
If the RSI continues to fall, XLM could face further price declines unless buyers step in soon to stabilize the trend and prevent a slide into more deeply oversold levels.
Stellar CMF Heavily Dropped Since April 1
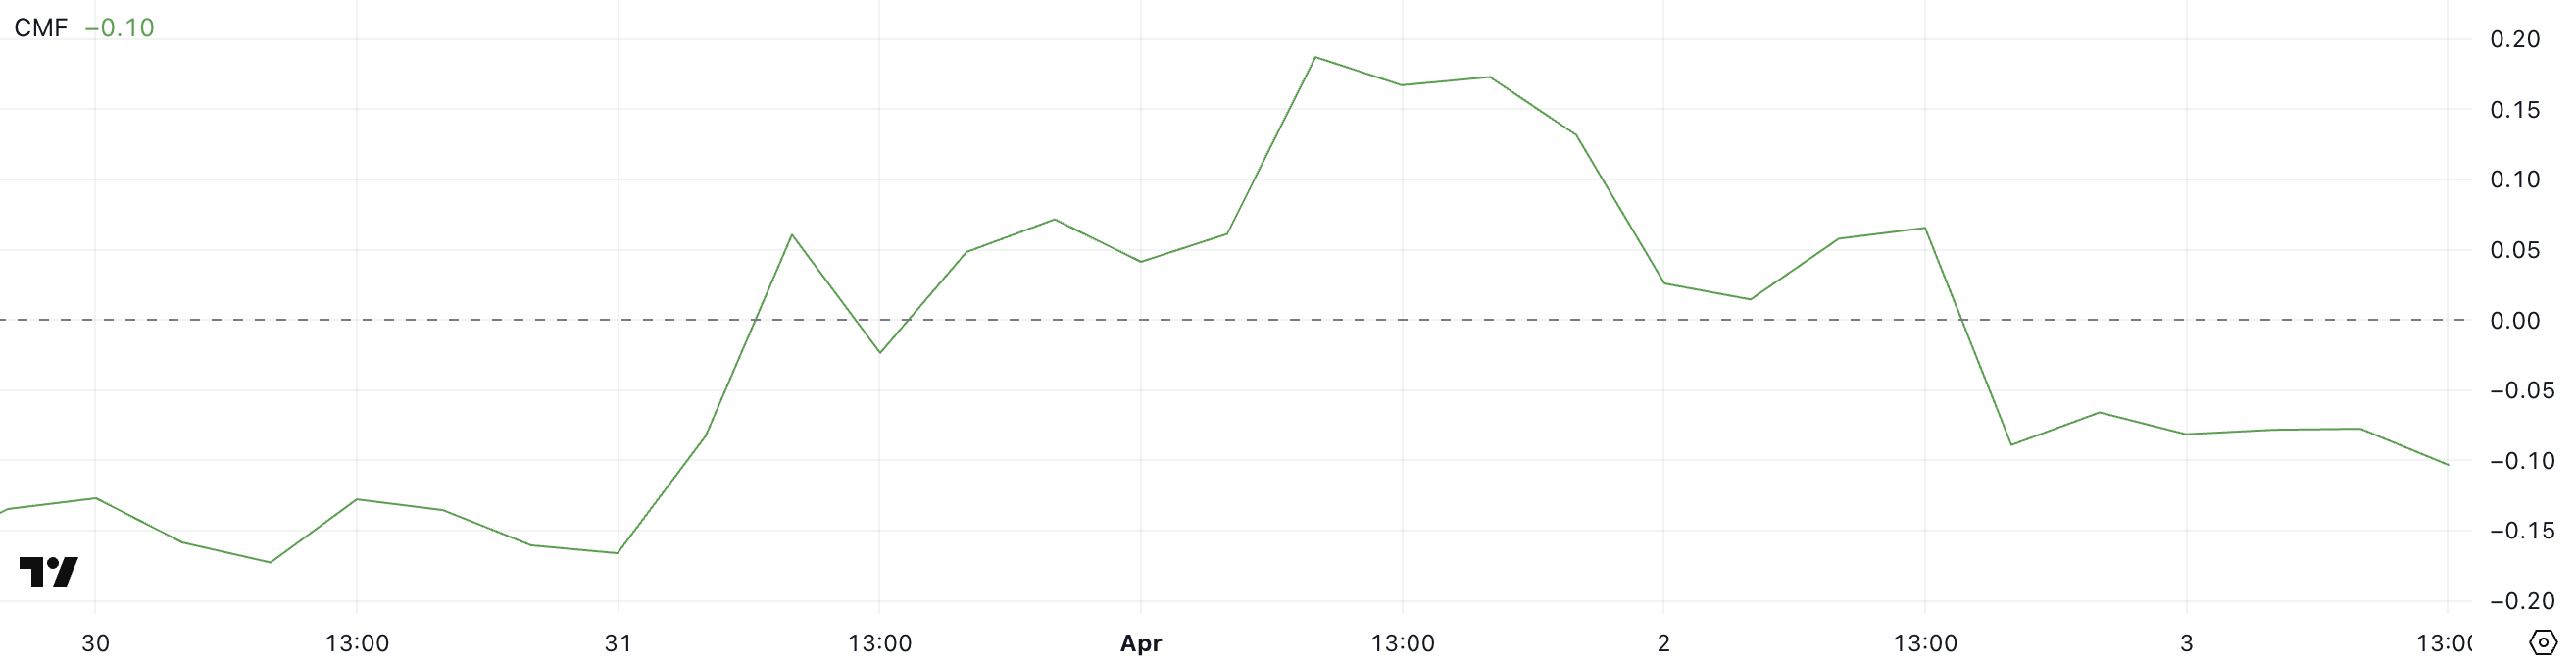
Stellar’s Chaikin Money Flow (CMF) has plunged to -10, a sharp decline from 0.19 just two days ago, signaling a significant shift in capital flow dynamics.
The CMF is an indicator that measures the volume-weighted average of accumulation and distribution over a set period—essentially tracking whether money is flowing into or out of an asset.
Positive values suggest buying pressure and accumulation, while negative values point to selling pressure and capital outflow.
 XLM CMF. Source:
TradingView.
With XLM’s CMF now deep in negative territory at -10, it indicates that sellers are firmly in control and substantial capital is leaving the asset.
This level of negative flow can put downward pressure on price, especially if it aligns with other bearish technical signals. Unless buying volume returns to offset this outflow, XLM could continue to weaken in the near term.
Will Stellar Fall To Five-Month Lows?
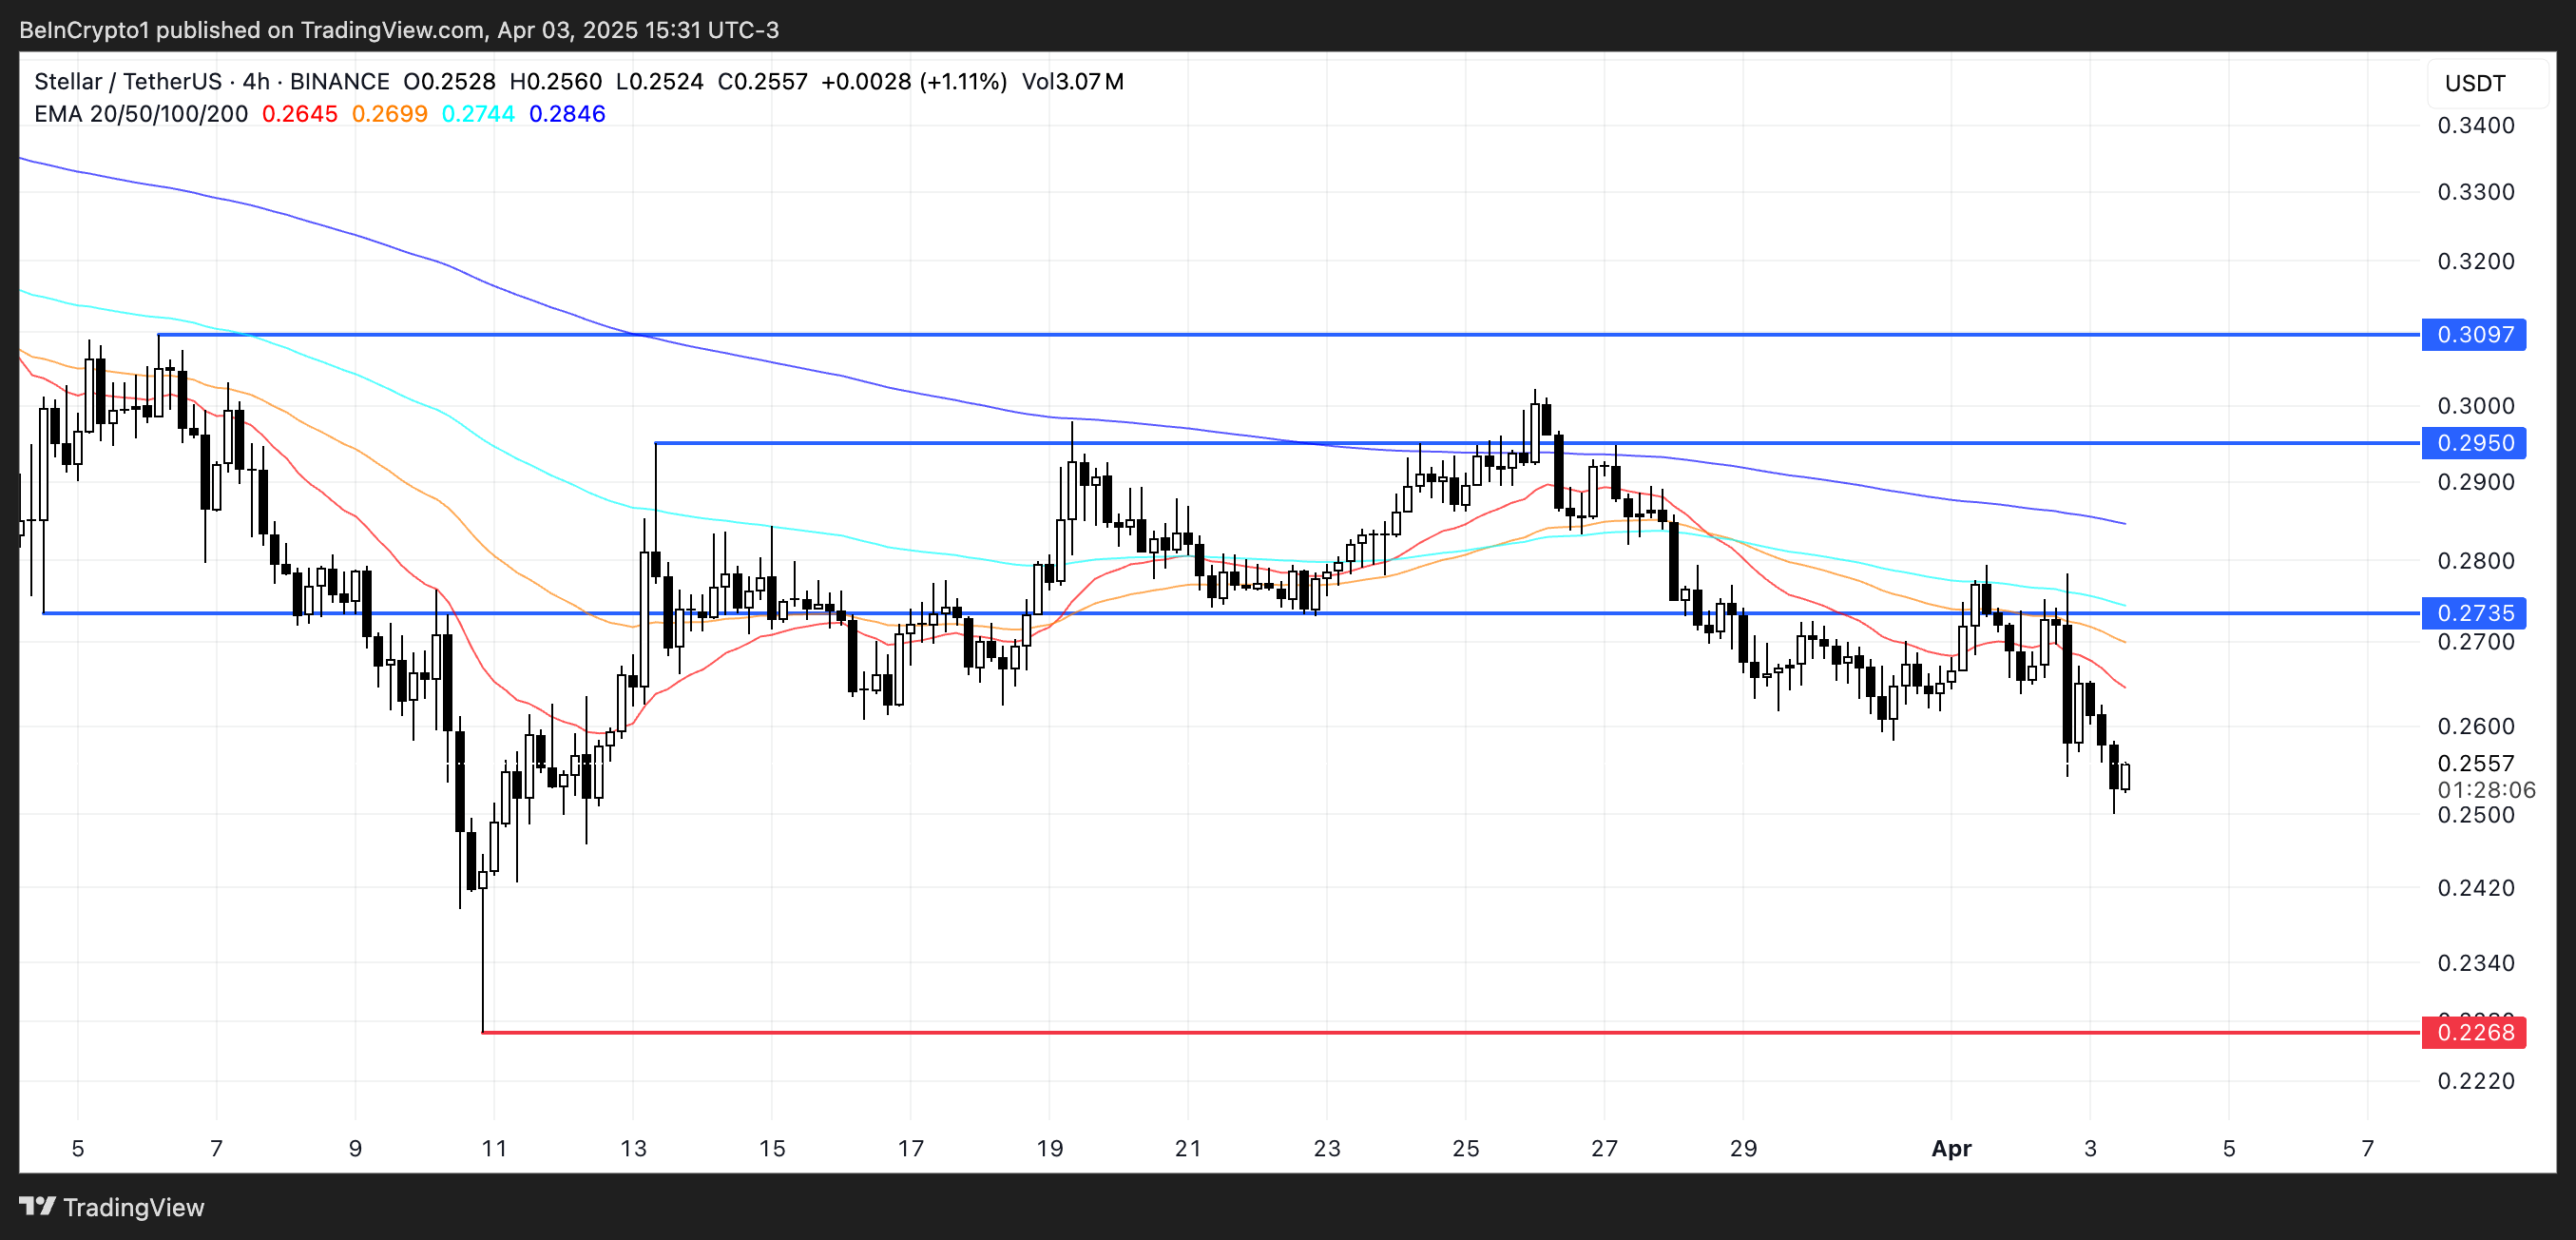
Stellar price action presents concerning signals as EMA indicators point to a strong bearish trend with significant downside potential.
Technical analysis suggests this downward momentum could push XLM to test critical support around $0.22. It could breach this level and fall below the psychologically important $0.20 threshold—a price not seen since November 2024.
This technical deterioration warrants caution from traders and investors as selling pressure appears to be intensifying.
 XLM Price Analysis. Source:
TradingView.
Conversely, a trend reversal scenario would require a substantial shift in market sentiment. Should bulls regain control, XLM could challenge the immediate resistance at $0.27, with further upside targets at $0.29 and the key $0.30 level.
However, this optimistic outlook faces considerable obstacles, as only a dramatic sentiment shift coupled with the emergence of a powerful uptrend would enable such a recovery.
Until clearer bullish signals manifest, the prevailing technical structure continues to favor the bearish case.
Disclaimer: The content of this article solely reflects the author's opinion and does not represent the platform in any capacity. This article is not intended to serve as a reference for making investment decisions.
You may also like
SoftBank reports first quarterly loss in two years! $3.7 billion impairment in US data center project, AI investments face pressure
SoftBank Group reported a net loss of 1.12 trillion yen in its second fiscal quarter, marking its first quarterly loss in nearly two years. The main reasons are the write-off of nearly $3.7 billion in advance payments due to adjustments in the procurement of power supply equipment for its AI data center in Ohio, USA, a shift of the Vision Fund from profit to loss, and a surge in the cost of high-debt financing. Since the June peak, SoftBank's share price has fallen more than 50%.
Expanding computing power on one hand, grabbing spectrum on the other! Barclays optimistic about SpaceX (SPCX.US) acquiring T-Mobile: Complementary advantages of ground networks and Starlink
After Space's stock price rose for two consecutive days, Barclays stated that T-Mobile is the "cleanest" choice among SpaceX’s potential acquisition targets. Barclays considers Verizon a major unknown, while AT&T has the lowest strategic fit.
Will the Federal Reserve raise rates in December? Tonight's CPI will be the final verdict!
The October CPI data will be released tonight, with the market pricing in an 86% chance of a rate hike. Goldman Sachs predicts a core CPI month-on-month increase of only 0.16%, much lower than market expectations. However, statistical distortions in health insurance and declines in used car prices—these "soft factors"—are unlikely to be reflected in the core PCE, which the Federal Reserve places greater emphasis on. The data may trigger a relief rally, but it is unlikely to change the underlying hawkish sentiment.

A 14x PE is not a bargain! Renowned wealth management CEO warns: If Nvidia (NVDA.US) earnings are revised down by 5%, its stock price could drop by 40%.
Ritholtz Wealth Management CEO Josh Brown questioned the idea that a 14x P/E ratio is a bargain and issued a warning: "If Nvidia's earnings over the next 12 months are revised down by 5% from our expectations, the stock could potentially drop by 40%."

Crypto prices
More


