
Will XRP Crash? Here’s What the Chart Is Warning Us About

XRP price has had a volatile journey in recent months, rising sharply to reclaim the $3 mark before entering a choppy downtrend. With recent bearish pressure building up and the price now hovering around $2.26, many traders are asking the tough question: is XRP on the edge of a major crash , or is this just another healthy correction before a new rally begins? Let's break down what the chart is showing and whether a deeper drop is likely.
XRP Price Prediction: Is XRP Losing Its Momentum?
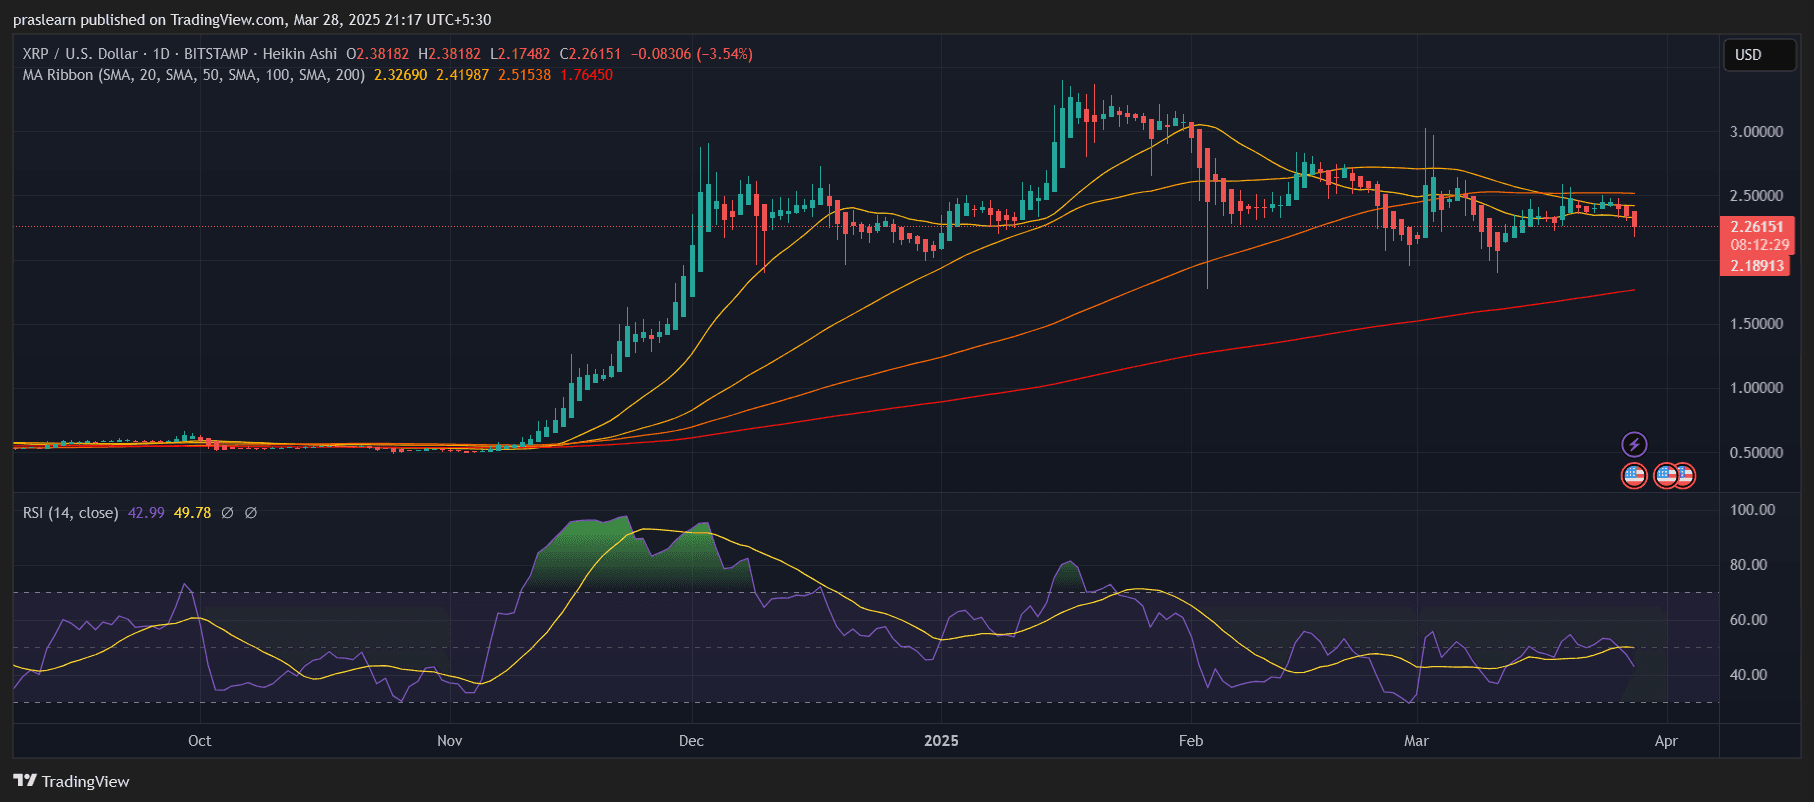 XRP/USD Daily Chart- TradingView
The most striking element in the chart is the fading bullish momentum. XRP price is currently trading below all short-term moving averages—the 20, 50, and 100-day simple moving averages (SMA)—which are now acting as resistance. The price attempted to push through these averages multiple times but failed, showing that buyers are not in control at the moment.
Additionally, Heikin Ashi candles are showing consistent red bodies with lower highs, a clear signal of ongoing bearish sentiment. The inability to break back above the $2.50 resistance zone, coupled with this sluggish behavior, suggests that XRP is struggling to hold its ground.
>>Click Here to Buy XRP on Bitget<<
What Does RSI Say About a Possible Breakdown?
The Relative Strength Index (RSI) currently sits around 42.9, leaning toward the bearish side of neutral. It hasn’t touched oversold levels yet, but it's also far from signaling any strong upward momentum. What’s concerning is that the RSI has been consistently trending downward since mid-February, and no bullish divergence has formed to suggest a reversal.
This weak RSI position hints that if selling pressure increases even slightly, XRP could dip quickly—possibly to test the next support around $2.00 or even down near the 200-day SMA at $1.76.
>>Click Here to Buy XRP on Bitget<<
XRP Crash: Where Are the Key Support and Danger Zones?
Looking at the broader picture, XRP price is still trading above the crucial 200-day SMA , which is currently near $1.76. This moving average has historically served as a last line of defense during downtrends. If XRP breaks below that level, it would technically confirm a full trend reversal into bearish territory, potentially opening the gates to a steeper fall toward the $1.50 level.
On the upside, XRP needs to reclaim $2.50 with strong volume to invalidate the bearish thesis. Only a daily close above that range could suggest renewed interest and a bullish recovery. Until then, the downside risk appears more likely than a sudden rebound.
XRP Price Prediction: Could This Turn Into a Major Crash?
The word “crash” in crypto usually implies a sharp 30–50% drop in a short span, and while XRP isn’t showing that severity yet, the current structure sets the stage for a possible deeper correction. If the broader crypto market enters a risk-off phase or if there’s any negative news around Ripple's ongoing regulatory situation, XRP could spiral downward fast .
That said, this isn’t panic territory just yet. The long-term structure isn’t broken, but short-term caution is definitely warranted. A failure to hold above the $2.00 psychological level would be a major red flag for bulls.
XRP Crash: Should Traders Be Worried?
XRP price is clearly under pressure , trading below key moving averages and showing declining momentum on the RSI. While it hasn't crashed yet, the warning signs are building. Traders should keep a close eye on the $2.00 support zone and the 200-day SMA near $1.76—those are the levels that could determine whether XRP bounces or breaks.
If you’re holding long-term, it might be time to prepare for short-term turbulence. If you're trading, this may be the moment to sit tight, wait for confirmation, and be ready for either a breakdown—or a surprise bounce.
Disclaimer: The content of this article solely reflects the author's opinion and does not represent the platform in any capacity. This article is not intended to serve as a reference for making investment decisions.
You may also like
Morgan Stanley Illustrates 'Blue Wave' Impact: 20% of New Data Center Projects May Be Delayed to 2029, 40% of Shipped Chips May 'Not Be Powered On' Before 2028
Morgan Stanley believes that the US midterm elections are substantially disrupting the construction pace of AI data centers—about 5GW of capacity will be postponed from 2028 to 2029, and up to 40% of chip deployments between 2026 and 2028 risk not being powered on time. The combined pressures of power shortages, political resistance, and rising costs are accelerating the shift of capital toward overseas markets such as Southeast Asia and India, potentially extending the overall AI capital expenditure cycle.
Risk is shifting! Goldman Sachs: Chipmakers' CDS spreads surpass hyperscale cloud providers for the first time, AI default swaps hit record highs
Goldman Sachs stated that AI credit risk is shifting from cloud giants to chip suppliers. For the first time in nearly three months, the chip CDS spread has surpassed that of hyperscale cloud providers, reflecting market concerns over intensified GPU depreciation and customer financing exposure. Impacted by a supply surge, bond issuance premiums for cloud providers have risen significantly, with durations shortening. As hundreds of billions of dollars in project financing flood in by 2027, pressure in the credit market is expected to continue accumulating.
Difficult to Monetize 3.57 Billion Orders? Neutron's Maiden Flight Delayed and Iridium (IRDM.US) Faces Acquisition Funding Pressure
Rocket Lab reported Q3 revenue of $268 million and outstanding orders totaling $3.57 billion. The maiden flight of the Neutron rocket has been postponed to 2027, with clients such as ICEYE having already reserved launch windows in advance. Although operating cash flow has turned positive, the planned acquisition of Iridium will require more than $3 billion in cash, with future revenue...
Crypto prices
More


