
Solana Price Ready to Explode or Fakeout Incoming?

Solana (SOL) , one of the top-performing altcoins of the last cycle, is now facing a critical technical moment. After a turbulent start to 2025 marked by a prolonged downtrend, the token is showing early signs of a potential trend shift. With recent price stabilization and a gradual climb from local lows, traders and investors alike are watching closely for the next big move. Is Solana preparing for a breakout that could reignite bullish momentum, or is this just another deceptive bounce before further downside? Let’s dive into the charts and indicators to find out what’s next.
Solana Price Prediction: Is Solana Price Gearing Up for a Major Trend Reversal?
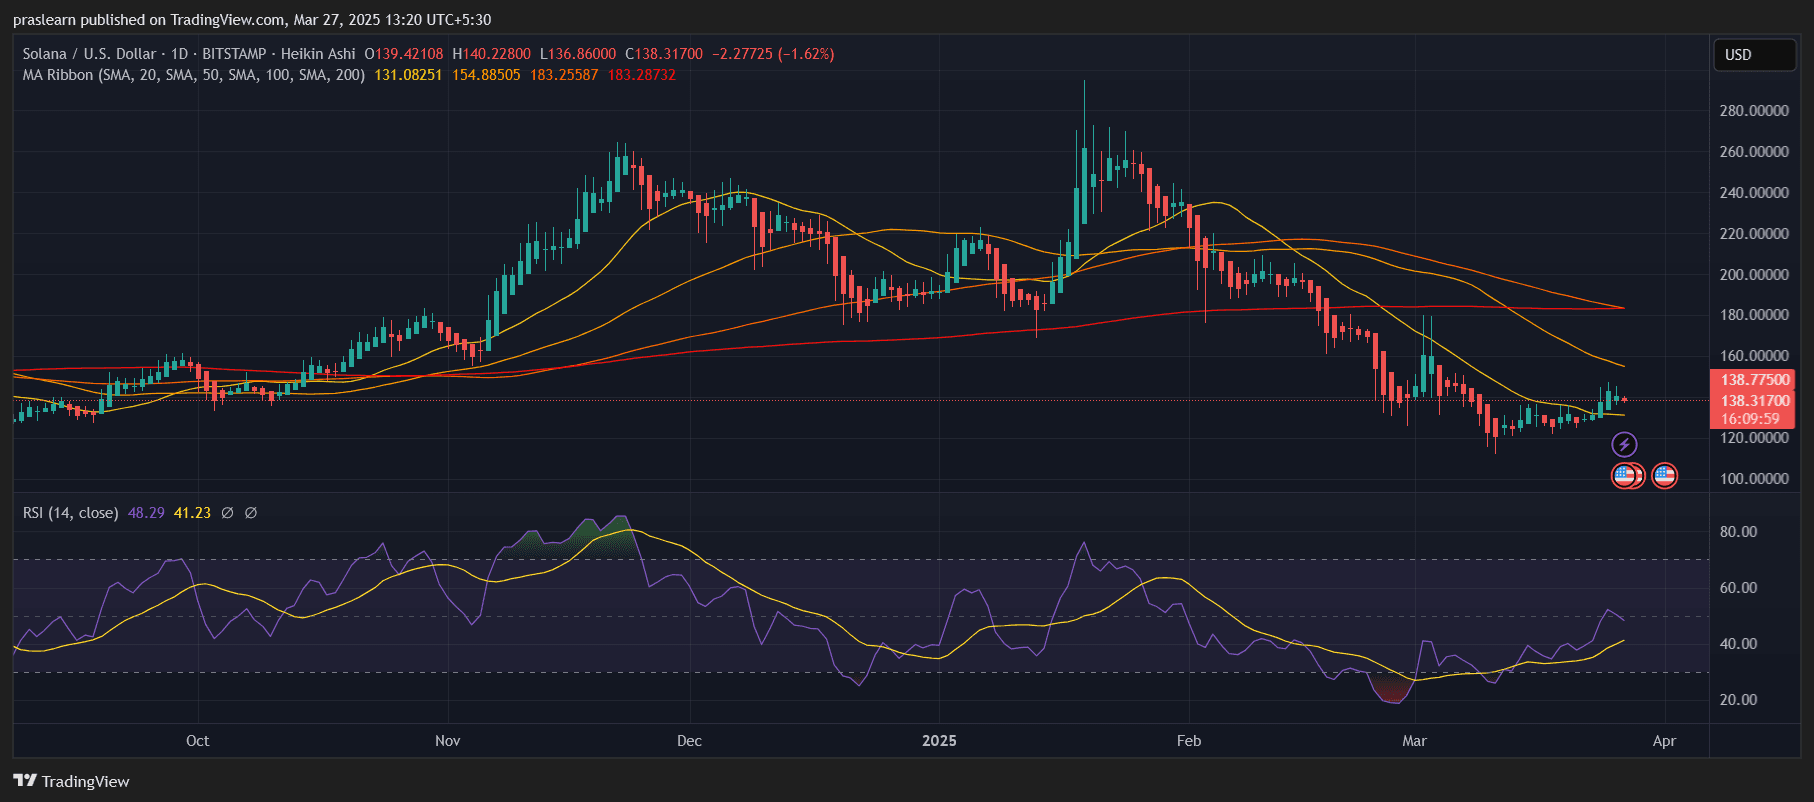 SOL/USD Daily Chart- TradingView
Solana (SOL) has been slowly climbing out of a multi-week downtrend that began after its local high near $210 in late December 2024. After bottoming out near the $120 level in early March, SOL price has shown signs of stabilization. This latest consolidation phase hints at an impending breakout—or a potential fakeout that could catch traders off guard.
On the daily chart, SOL price has reclaimed the 20-day Simple Moving Average (SMA) and is attempting to establish support above it. However, the price is still below the 50-day and 100-day SMAs, which currently act as dynamic resistance levels near $154 and $183, respectively. The 200-day SMA—hovering at approximately $183.28—remains a long-term ceiling, emphasizing that SOL still needs to prove itself before a full-blown bullish trend resumes.
>>Click Here to Buy Solana on Bitget<<
Is Momentum Building or Stalling?
Momentum indicators paint a mixed picture. The Relative Strength Index (RSI) sits at 48.29, marginally below the neutral 50 mark. While this shows recovery from the oversold levels seen earlier in March, it also reflects hesitation. RSI’s inability to push above 50 suggests that buying pressure remains tentative, and a sharp move in either direction could follow.
It’s worth noting that the RSI has formed a higher low, which typically precedes a price rally. But for confirmation, the RSI must break above 55–60 territory. Until then, the risk of range-bound or downward movement still lingers.
What Are the Key Resistance and Support Levels to Watch?
On the support side, $130 stands out as the immediate psychological and technical level. If SOL fails to hold above this zone, the next major demand region lies around $120, where the recent bottom was formed.
On the upside, the $145–$155 range represents the first major challenge, aligning with both price structure and the 50-day SMA. A clean breakout above this band would open the gates to $170 and potentially retest $183—where the 200-day SMA looms. A daily close above $183 would be a strong bullish signal, possibly triggering a momentum-driven rally toward $200+ levels.
>>Click Here to Buy Solana on Bitget<<
Could a Breakout Be Imminent or Is It a Bull Trap?
The current chart structure resembles a rounded bottom pattern with a tightening price range. This pattern often precedes a breakout move, and the confluence of narrowing candles with rising volume could confirm such a move soon. However, without a decisive close above $155 and sustained buying pressure, the risk of a bull trap remains high.
Volume analysis and RSI divergence will be critical in the next few sessions. If buyers step in strongly on higher-than-average volume while RSI climbs above 50, it may validate a genuine breakout. On the contrary, a failed test of the $145–$150 resistance zone followed by a breakdown below $130 would likely trigger a retest of March lows.
Solana Price Prediction: What's Next?
If bulls manage to push Solana price above $155 in the next few days, the next price target lies around $170, with a bullish extension potentially reaching $200 within the next few weeks. However, failure to do so could result in a pullback toward $130 or even $120 before any sustainable rally takes place.
Overall, Solana is at a pivotal technical juncture. The price is compressing between short-term moving averages and horizontal resistance, indicating a strong move is imminent. Whether it's upward or downward depends on how price reacts to the $145–$155 resistance range in the coming sessions.
Disclaimer: The content of this article solely reflects the author's opinion and does not represent the platform in any capacity. This article is not intended to serve as a reference for making investment decisions.
You may also like
Morgan Stanley Illustrates 'Blue Wave' Impact: 20% of New Data Center Projects May Be Delayed to 2029, 40% of Shipped Chips May 'Not Be Powered On' Before 2028
Morgan Stanley believes that the US midterm elections are substantially disrupting the construction pace of AI data centers—about 5GW of capacity will be postponed from 2028 to 2029, and up to 40% of chip deployments between 2026 and 2028 risk not being powered on time. The combined pressures of power shortages, political resistance, and rising costs are accelerating the shift of capital toward overseas markets such as Southeast Asia and India, potentially extending the overall AI capital expenditure cycle.
Risk is shifting! Goldman Sachs: Chipmakers' CDS spreads surpass hyperscale cloud providers for the first time, AI default swaps hit record highs
Goldman Sachs stated that AI credit risk is shifting from cloud giants to chip suppliers. For the first time in nearly three months, the chip CDS spread has surpassed that of hyperscale cloud providers, reflecting market concerns over intensified GPU depreciation and customer financing exposure. Impacted by a supply surge, bond issuance premiums for cloud providers have risen significantly, with durations shortening. As hundreds of billions of dollars in project financing flood in by 2027, pressure in the credit market is expected to continue accumulating.
Difficult to Monetize 3.57 Billion Orders? Neutron's Maiden Flight Delayed and Iridium (IRDM.US) Faces Acquisition Funding Pressure
Rocket Lab reported Q3 revenue of $268 million and outstanding orders totaling $3.57 billion. The maiden flight of the Neutron rocket has been postponed to 2027, with clients such as ICEYE having already reserved launch windows in advance. Although operating cash flow has turned positive, the planned acquisition of Iridium will require more than $3 billion in cash, with future revenue...
Crypto prices
More


