
Ethereum Supply Dries Up on Exchanges as Leverage Spikes—Bullish Signs for ETH?

Leading altcoin Ethereum has noted a 9% uptick in the past week as the broader cryptocurrency market attempts a recovery from recent lows.
While the rally is partly fueled by the gradual resurgence in the general market’s bullet sentiment, two key on-chain metrics suggest that ETH’s momentum could strengthen further.
ETH’s Supply Hits Yearly Low While Traders Bet Big
On-chain data reveals that ETH’s exchange reserve has dropped to its lowest level this year. As of this writing, the metric stands at 18.32 million ETH, plummetting 7% from its year-to-date peak of 19.74 million coins reached on February 2.
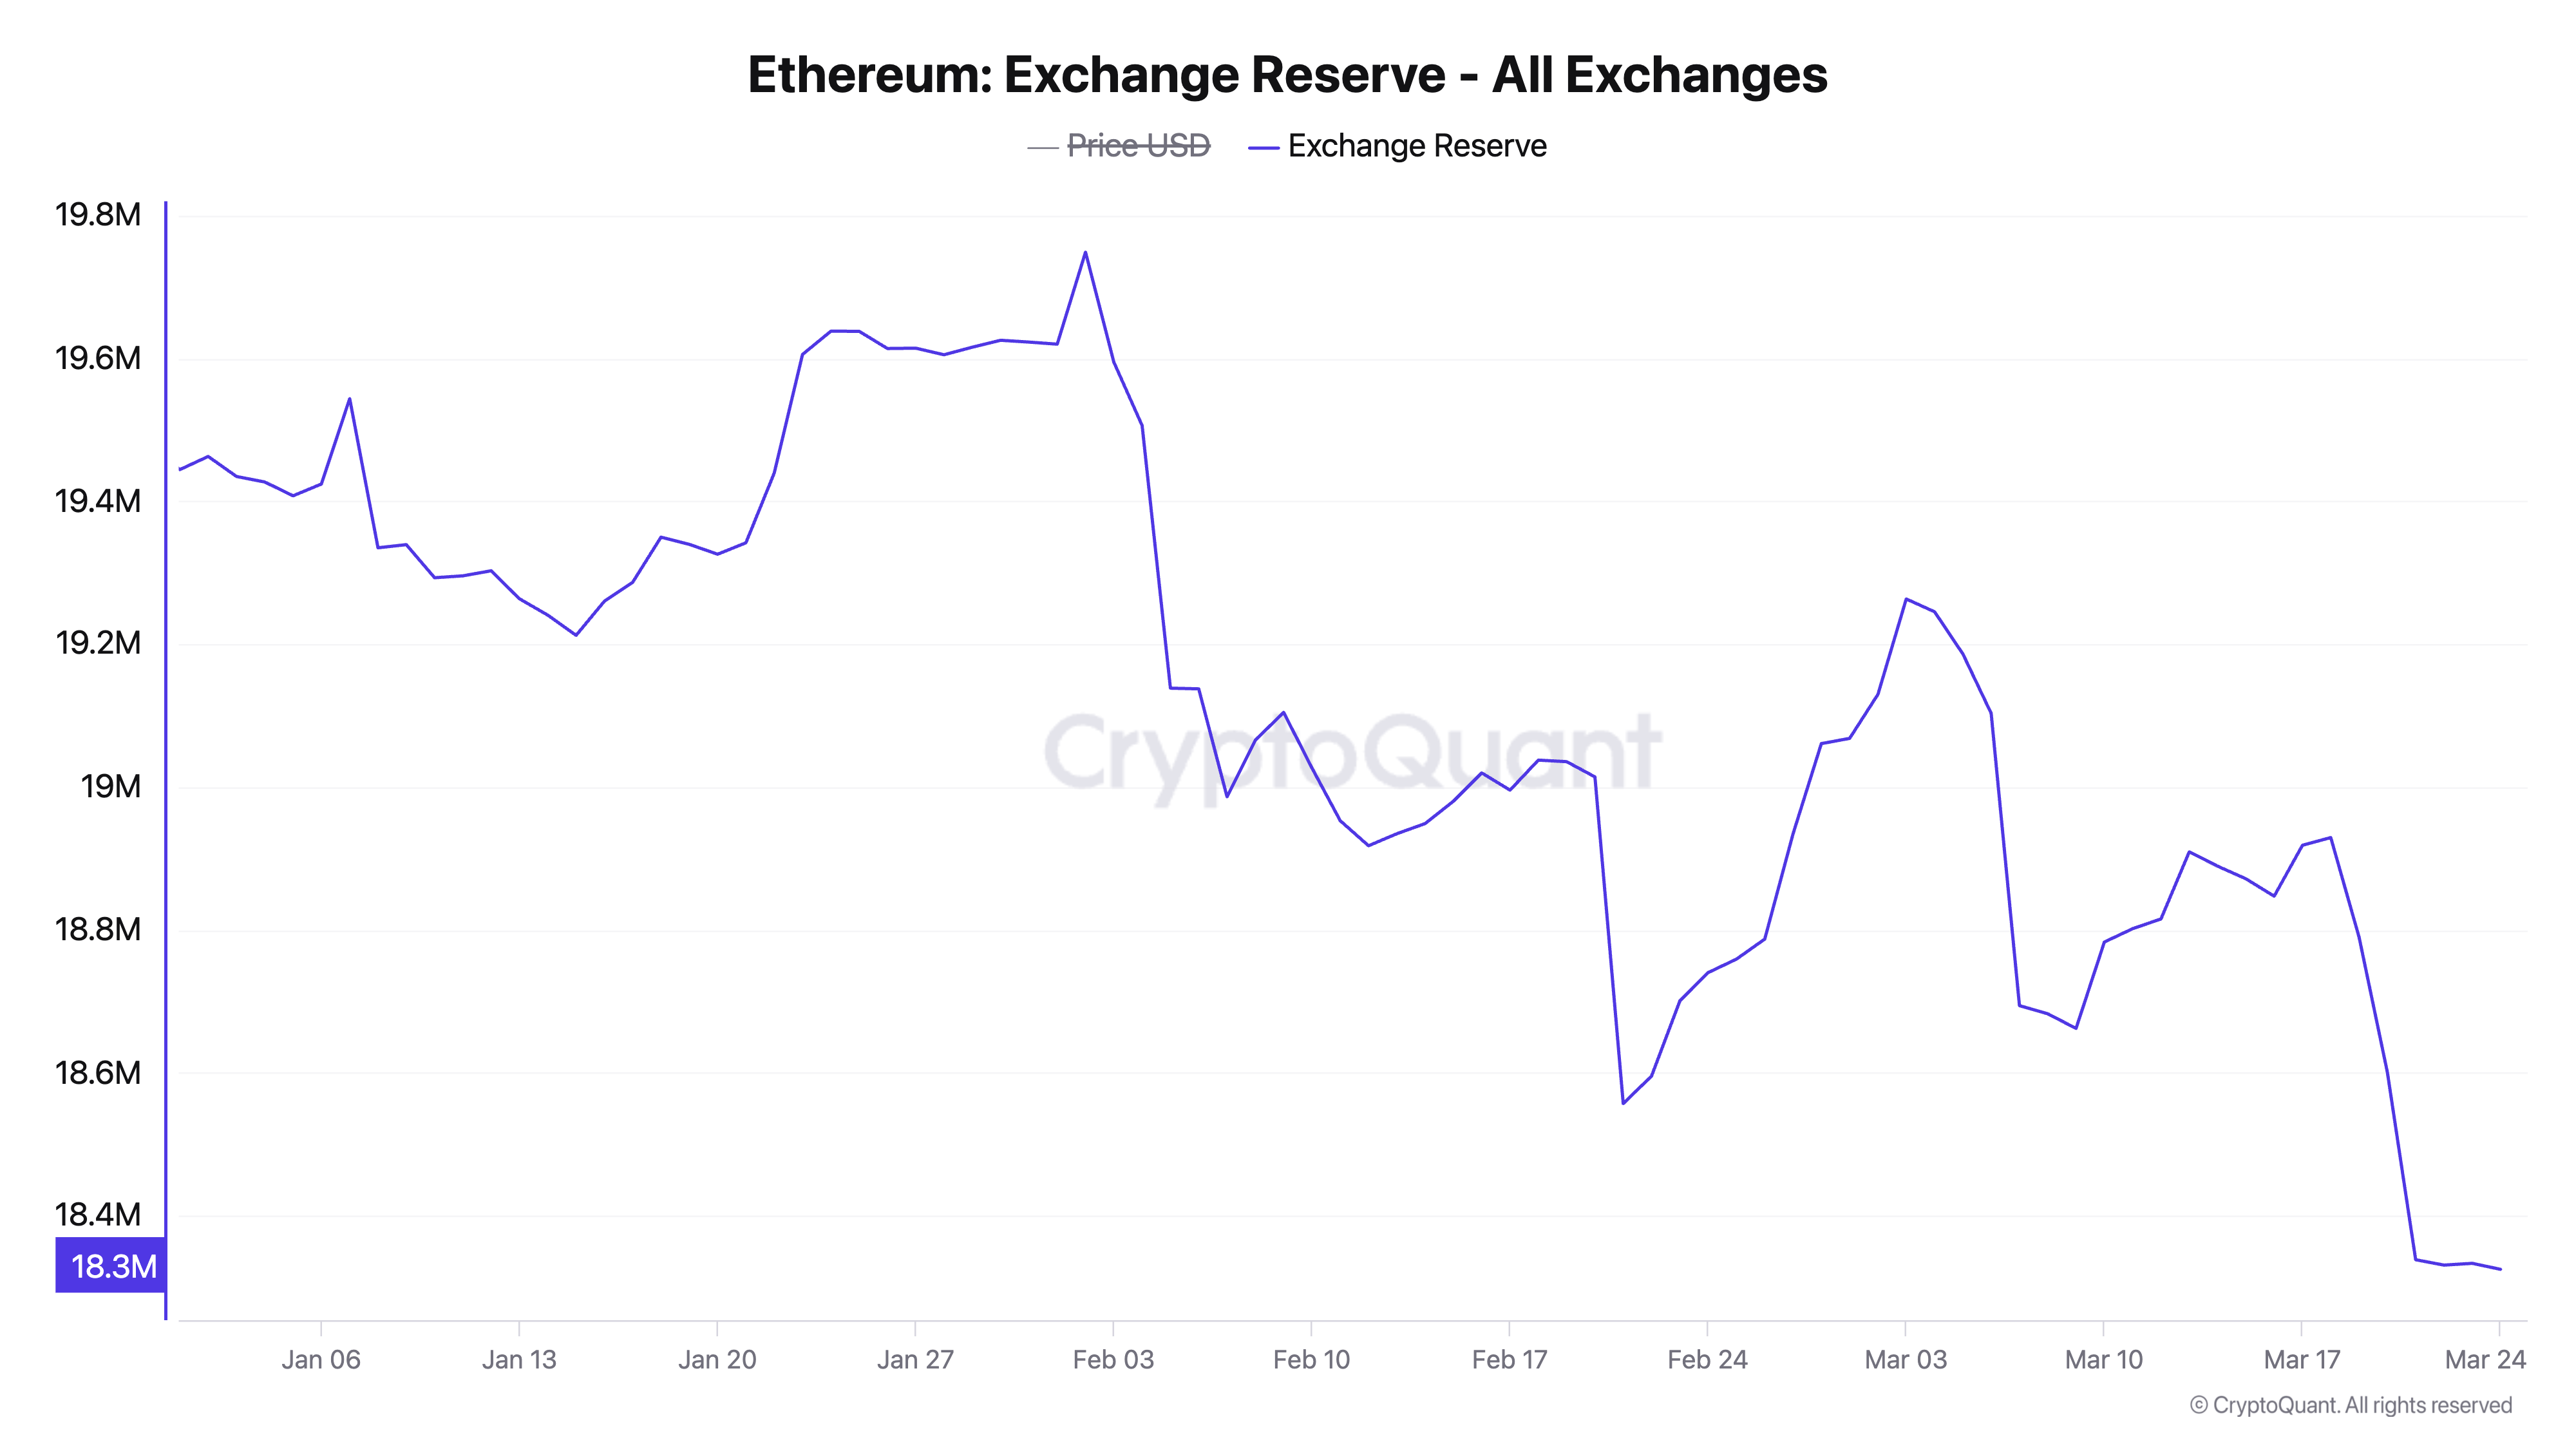
An asset’s exchange reserve measures the total amount of its coins or tokens held in exchange wallets, representing the supply available for immediate trading. When it declines, traders move their holdings off exchanges for long-term storage, staking, or spot ETH ETFs, thereby reducing the asset’s available supply.
This means that ETH’s supply decline can create upward price pressure, as lower selling liquidity and steady demand tend to drive its price higher.
Further, ETH’s Estimated Leverage Ratio (ELR) has climbed, suggesting that traders are increasingly using leverage to amplify their bets on the coin’s future price gains.
For context, ELR reached a year-to-date high of 0.686 on March 21 before witnessing a minor pullback. As of this writing, ETH’s ELR is at 0.683.
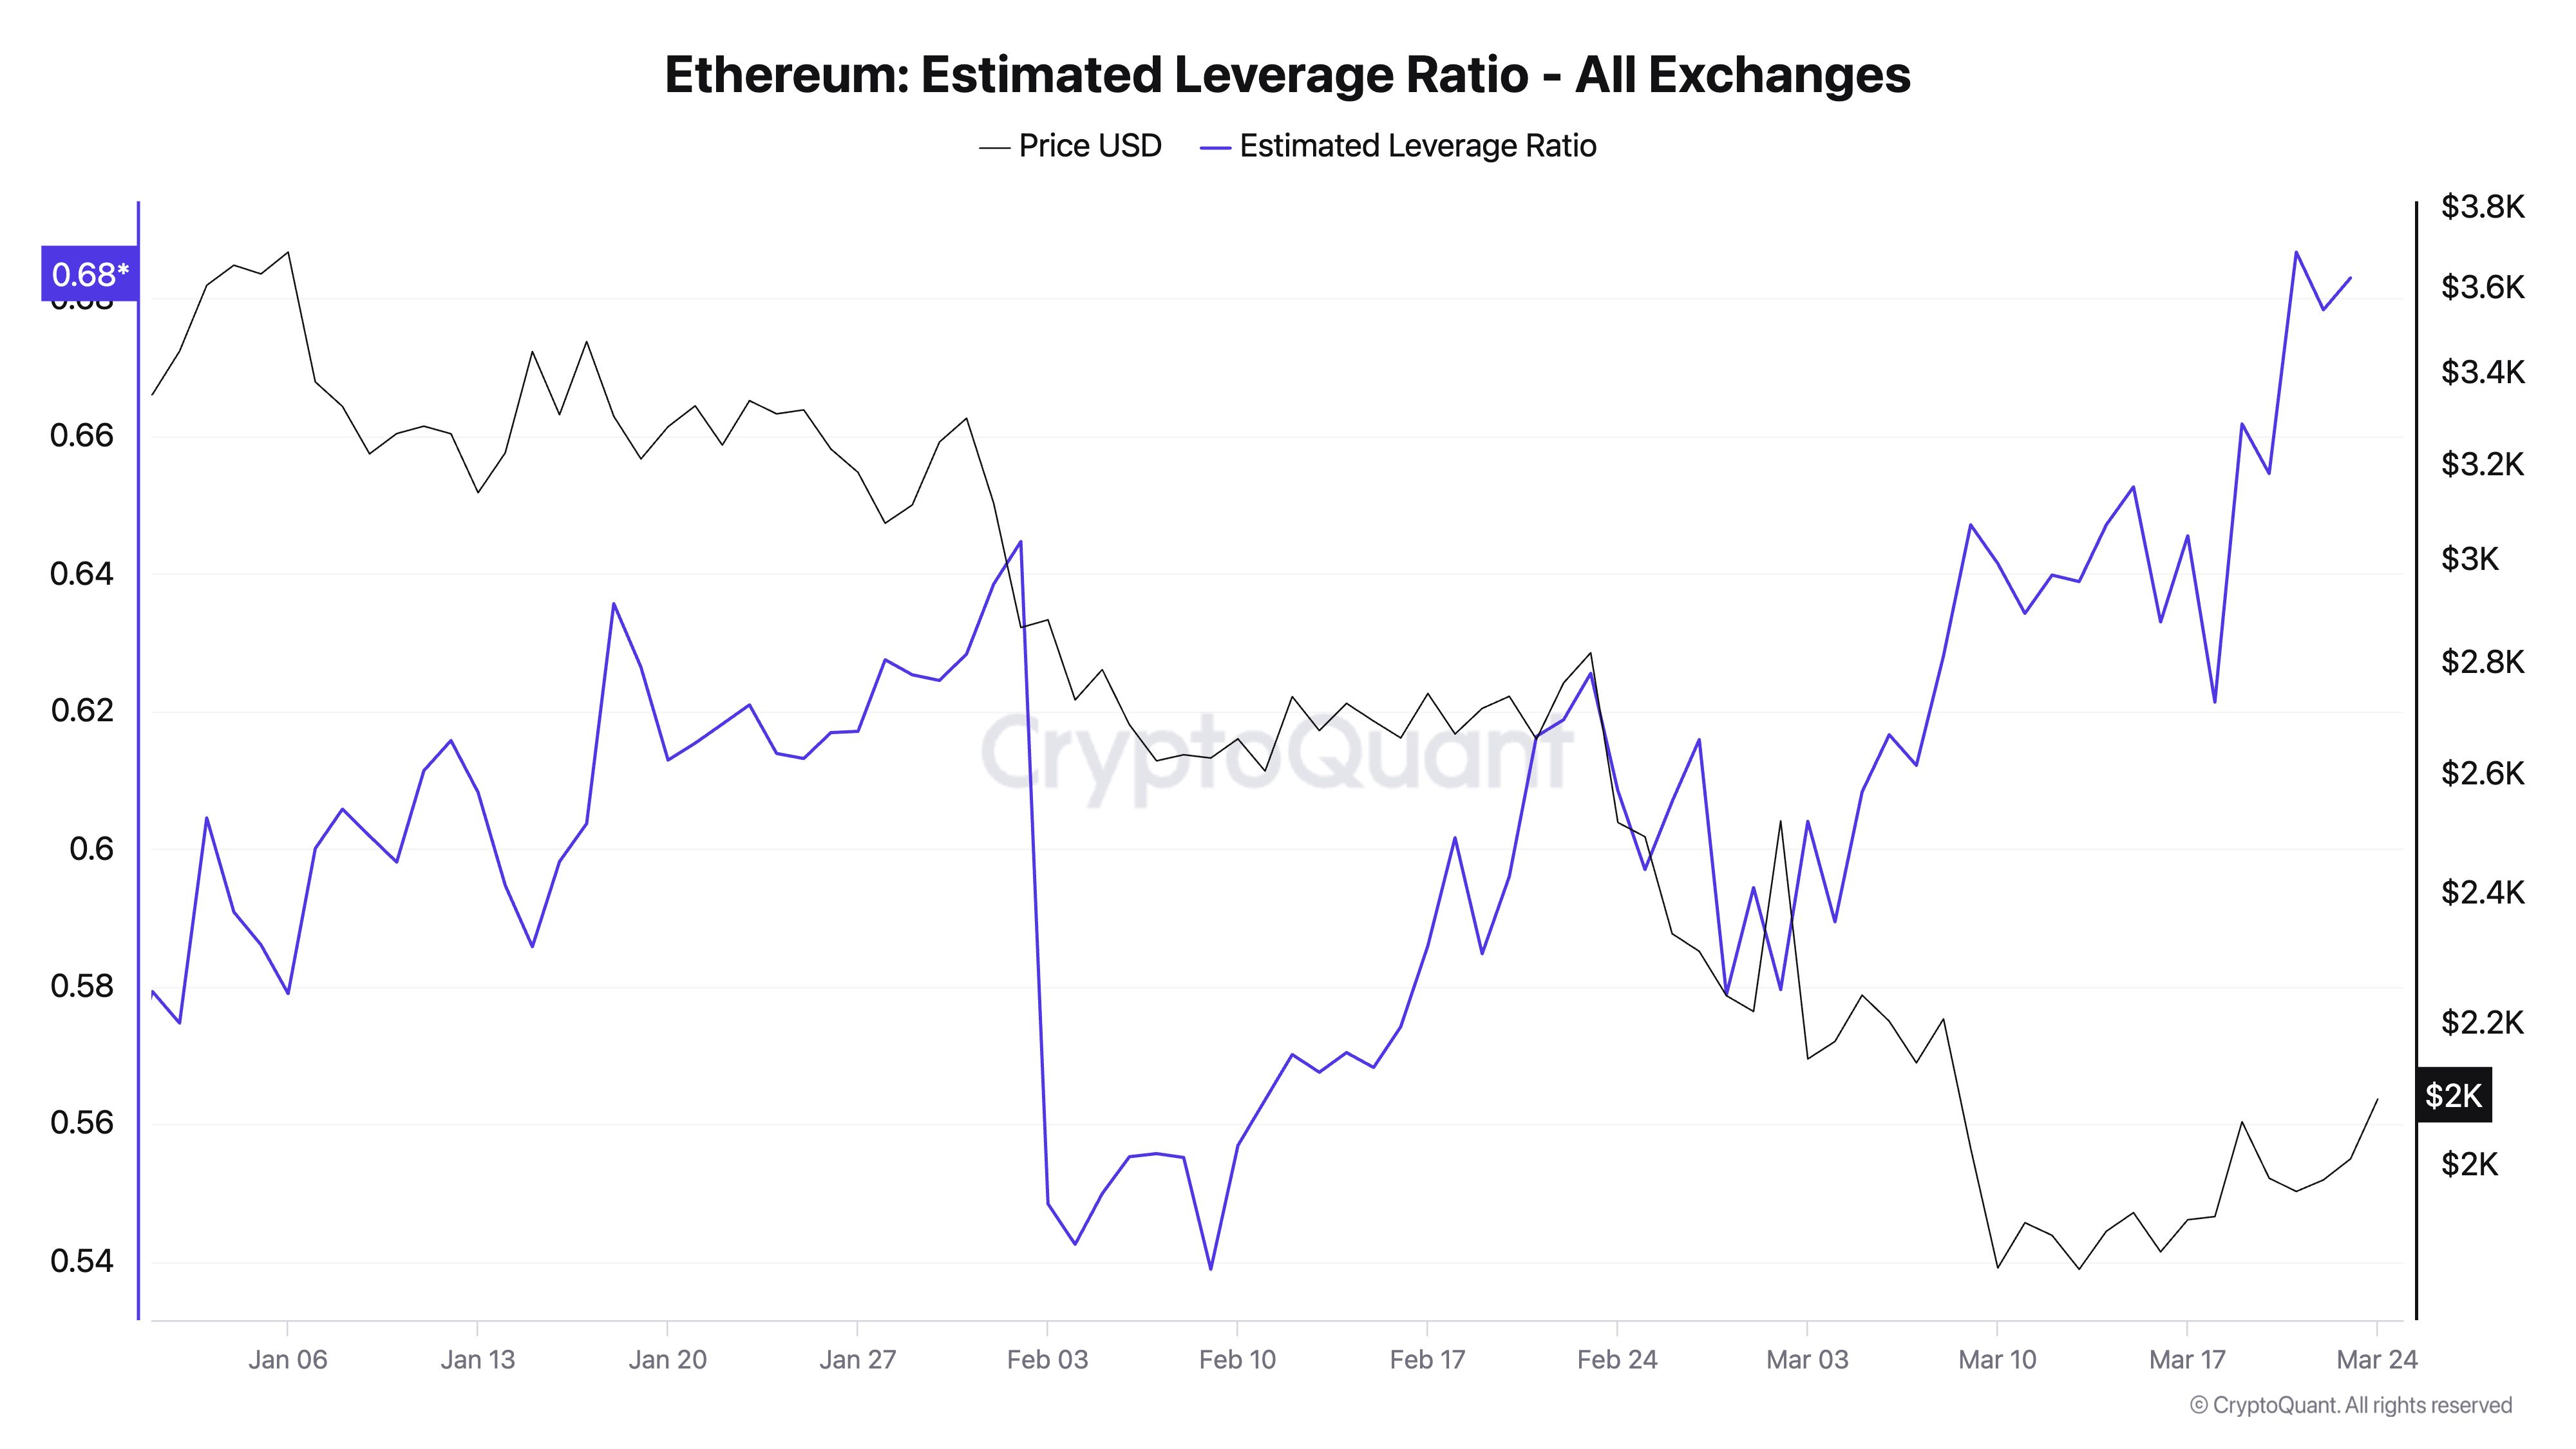
The ELR measures the average amount of leverage traders use to execute trades on a cryptocurrency exchange. It is calculated by dividing the asset’s open interest by the exchange’s reserve for that currency.
ETH’s surging ELR signals an increased risk appetite among traders despite its price troubles since the beginning of the year. This trend indicates that many coin holders remain optimistic about a near-term rally and are willing to leverage their positions to amplify potential gains.
ETH at a Turning Point: Will Bulls Drive It to $2,224 or Bears Pull It to $1,924?
ETH currently trades at $2,089, registering 4% gains over the past day. The green histogram bar posted by its Elder-Ray Index reflects the growing bullish bias toward the altcoin. It is at 52.80 at press time, its highest in the past 30 days.
The indicator measures buying and selling pressure in the market. When its value is positive, it indicates that buyers are dominant, suggesting stronger bullish momentum and a potential price uptrend.
If ETH bulls strengthen their control, they could push the coin’s price to $2,148.
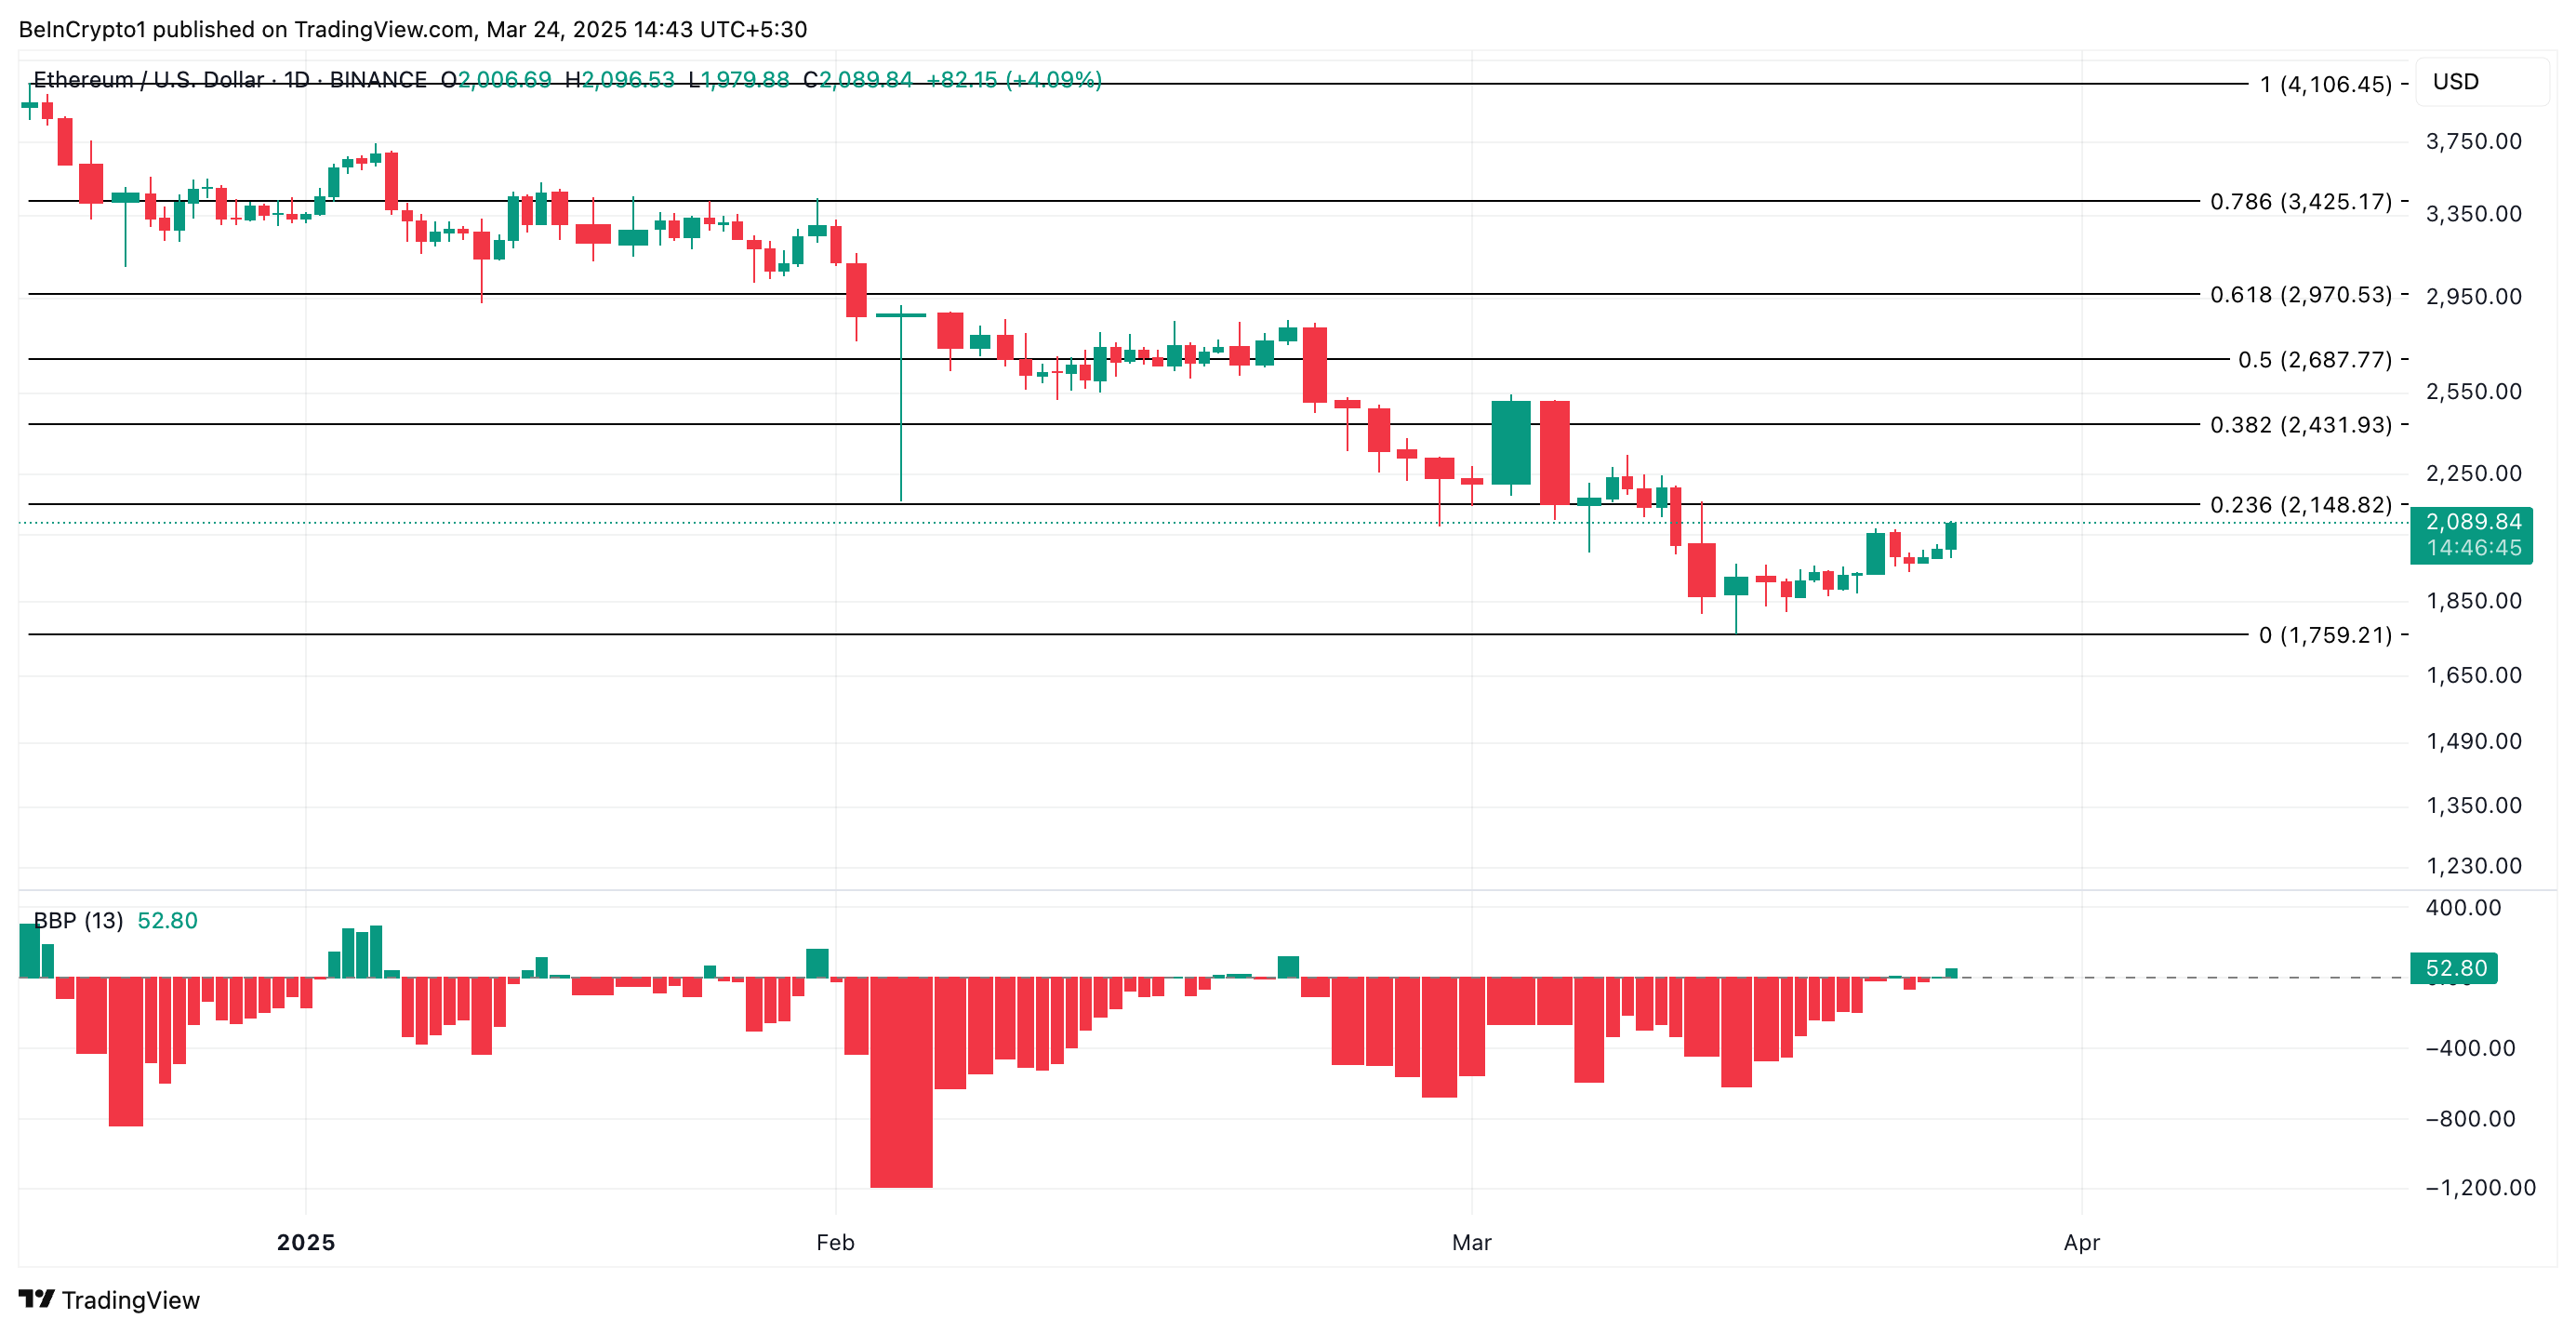
However, if the bears regain dominance, the altcoin’s value could fall to $1,759.
Disclaimer: The content of this article solely reflects the author's opinion and does not represent the platform in any capacity. This article is not intended to serve as a reference for making investment decisions.
You may also like
AUD/JPY Price Forecast: Weakens below 109.50 as bearish signals reinforce downside bias
6 Signals to Time the AI Bubble Bursting — A Framework

Interpretation of US Stock IPOs | The “midlife business” of S2B2C private domain e-commerce: How does QQJ.US Global Home Select tell its growth story?
What exactly gives the global elite the confidence to make an impact on Nasdaq?
Morgan Stanley's "Memory Grim Reaper" Shawn Kim Issues Another Warning! The Real Bombshell Is the "2028 Earnings Cliff," Comprehensive Target Price Cuts for Memory Stocks
Shawn Kim has significantly lowered target prices for memory stocks, cutting SK Hynix's target price by 38% and Samsung Electronics' by 19%. He warns that the industry could face a "profit cliff" in 2028: new production capacity coming online at the end of 2027, data center construction delays, narrowing HBM premiums, and a roughly 20% drop in NAND spot prices over the past two weeks. With these four pressures combined, he has substantially reduced his long-term DRAM profit margin assumptions for both companies, bringing them closer to historical averages.

Crypto prices
More


