
Kaspa (KAS) Stages Strong Comeback, Soars 15% from Two-Year Low

Kaspa (KAS) has surged 15% after hitting a two-year low, supported by strong trading volume and a shift in market sentiment. If support at $0.065 holds, KAS could see further gains.
KAS has emerged as the market’s top gainer in the past 24 hours. Its price has surged by 15% after hitting a two-year low during Tuesday’s trading session.
The rebound comes amid a broader resurgence in crypto market activity, with increased trading volumes and rising open interest signaling renewed investor confidence.
KAS Rally Backed by Rising Demand
A corresponding uptick in trading volume has accompanied KAS’ double-digit gains. During the review period, the coin’s daily trading volume totaled $189 million, rising by over 95%.
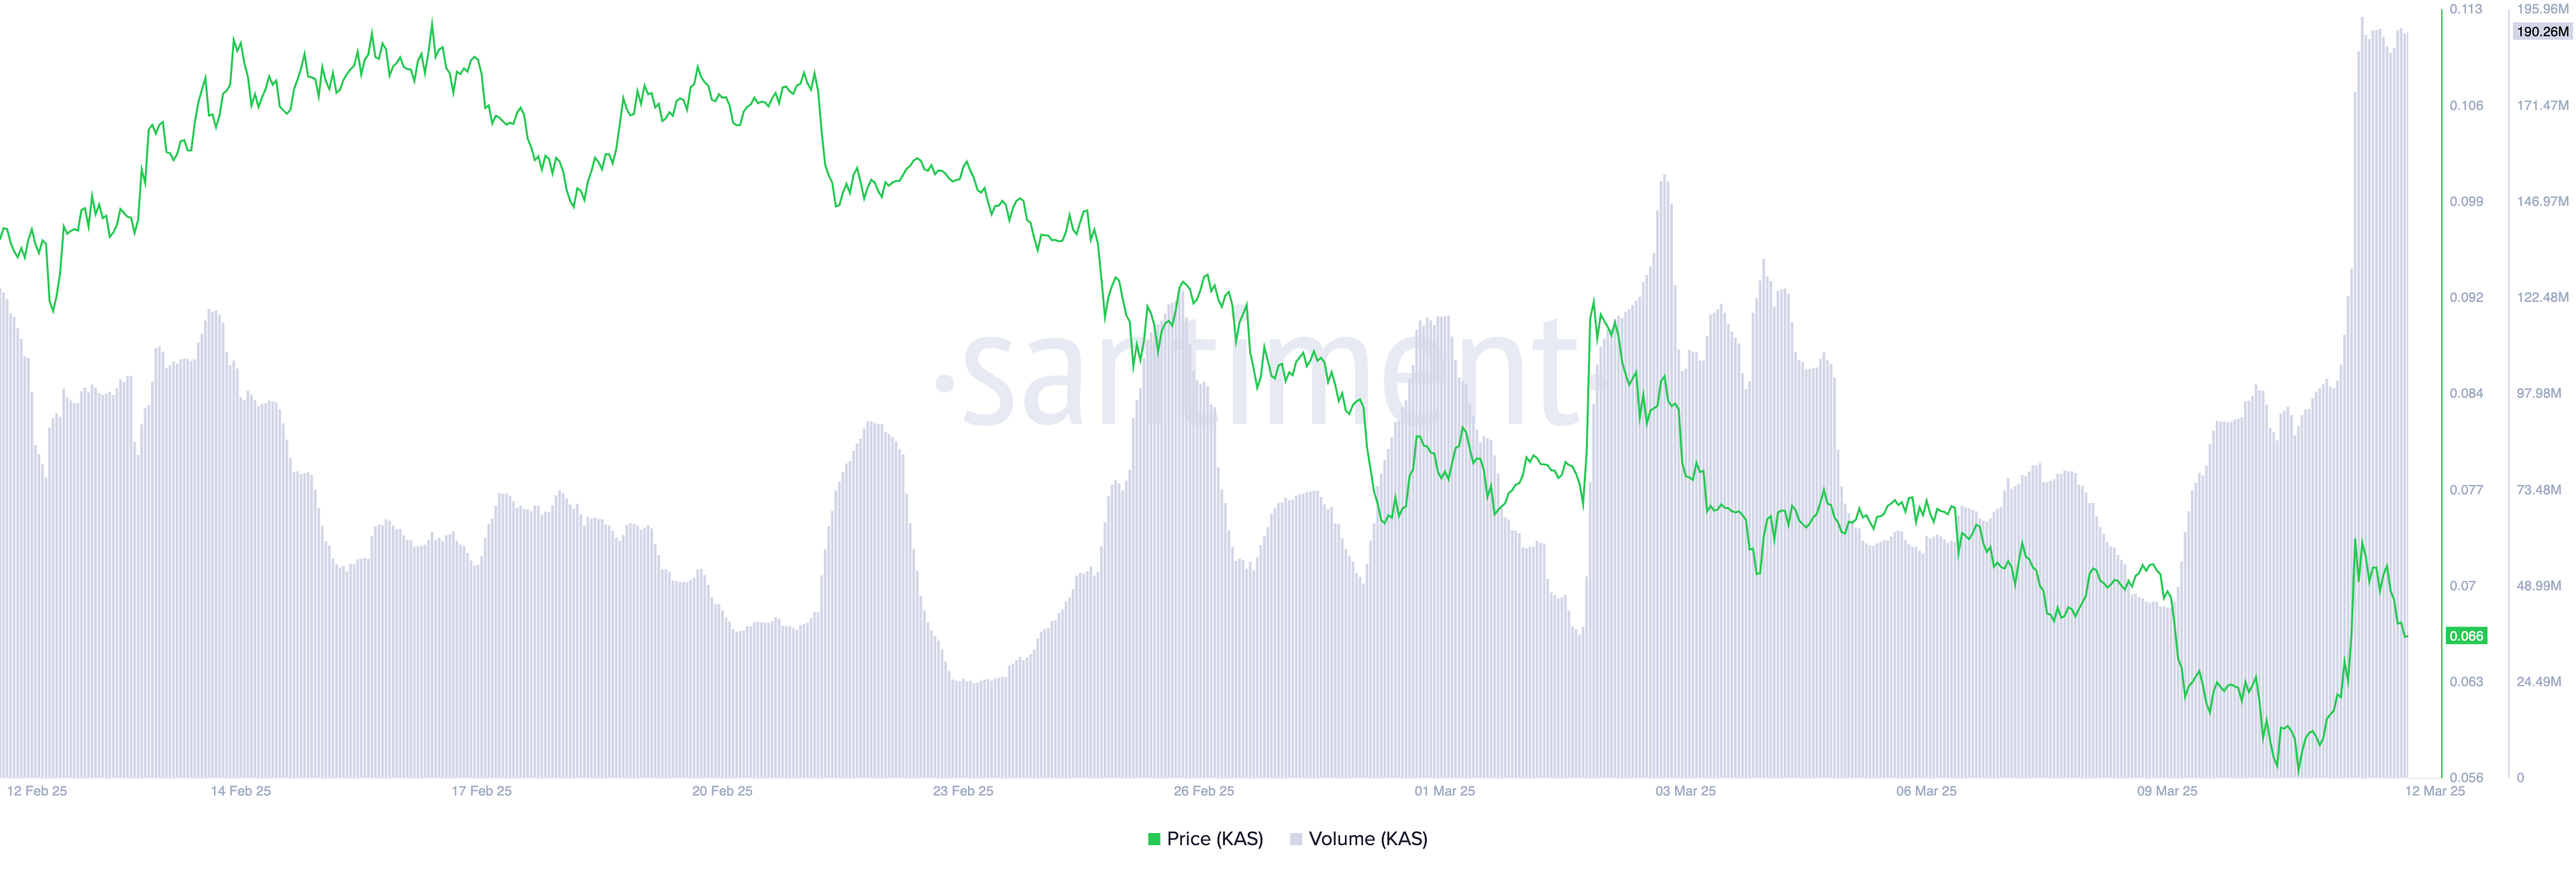 KAS Price and Trading Volume. Source:
Santiment
When an asset’s trading volume rallies alongside its price, it indicates strong market participation and increased investor interest. Higher volume confirms that KAS’ price increase is backed by real demand, not speculative trades.
Also, the coin’s rising open interest reflects this. At press time, this is at $64 million, climbing 7% over the past day.
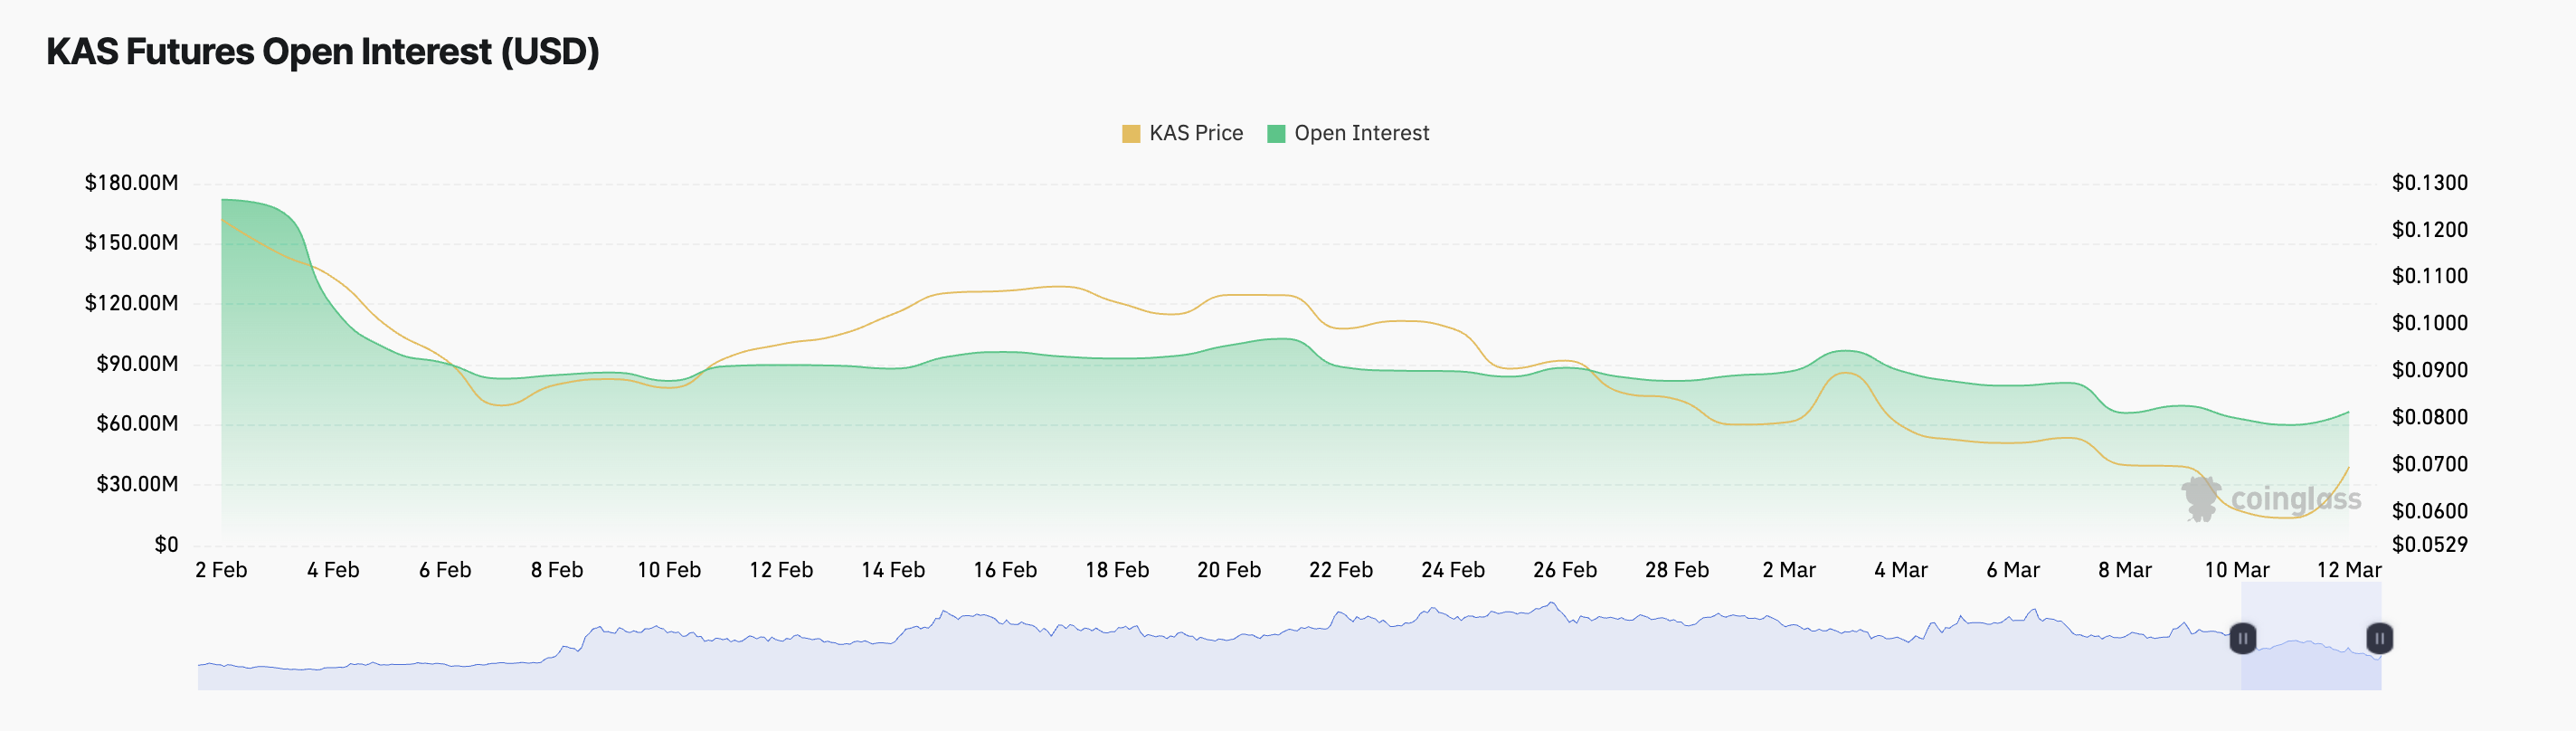 KAS Open Interest. Source:
Coinglass
Open interest refers to the total number of outstanding derivative contracts that have not been settled. As it climbs, it suggests increased market participation and fresh capital entering KAS positions. This signals growing confidence in the asset’s price trend and hints at a sustained uptrend if it continues.
Moreover, the coin’s funding rate has flipped from negative to positive, highlighting the bullish shift in sentiment toward KAS. At press time, this stands at 0.0013%.
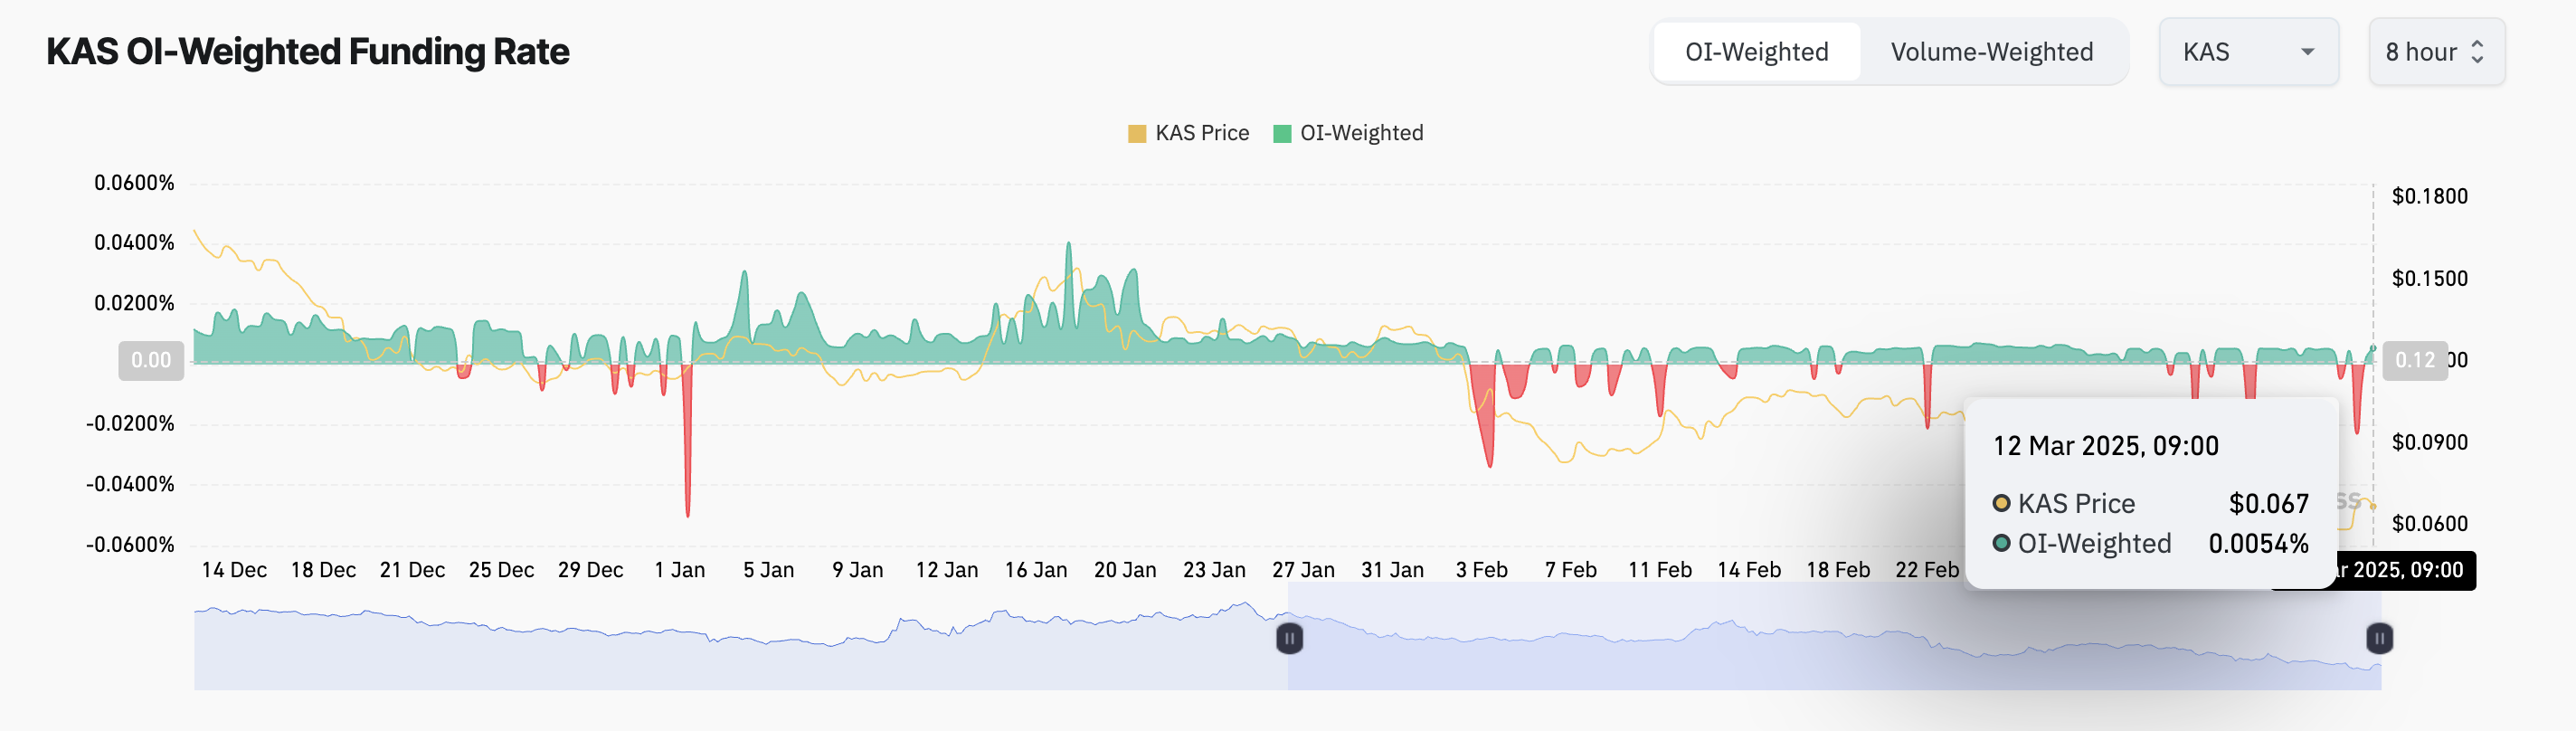 KAS Funding Rate. Source:
Coinglass
The funding rate is the periodic fee exchanged between long and short traders in perpetual futures contracts to keep the contract price aligned with the spot price. When its value is positive, it means long traders are paying short traders. This trend indicates that the market sentiment is bullish, and traders are willing to pay a premium to maintain their long positions.
Kaspa (KAS) Tests Critical Support at $0.065—Breakout or Breakdown Ahead?
KAS currently trades at $0.066, bouncing off the support formed at $0.065. It could continue its uptrend if this price zone is established as a strong support floor. In that case, KAS could exchange hands at $0.081 in the near term.
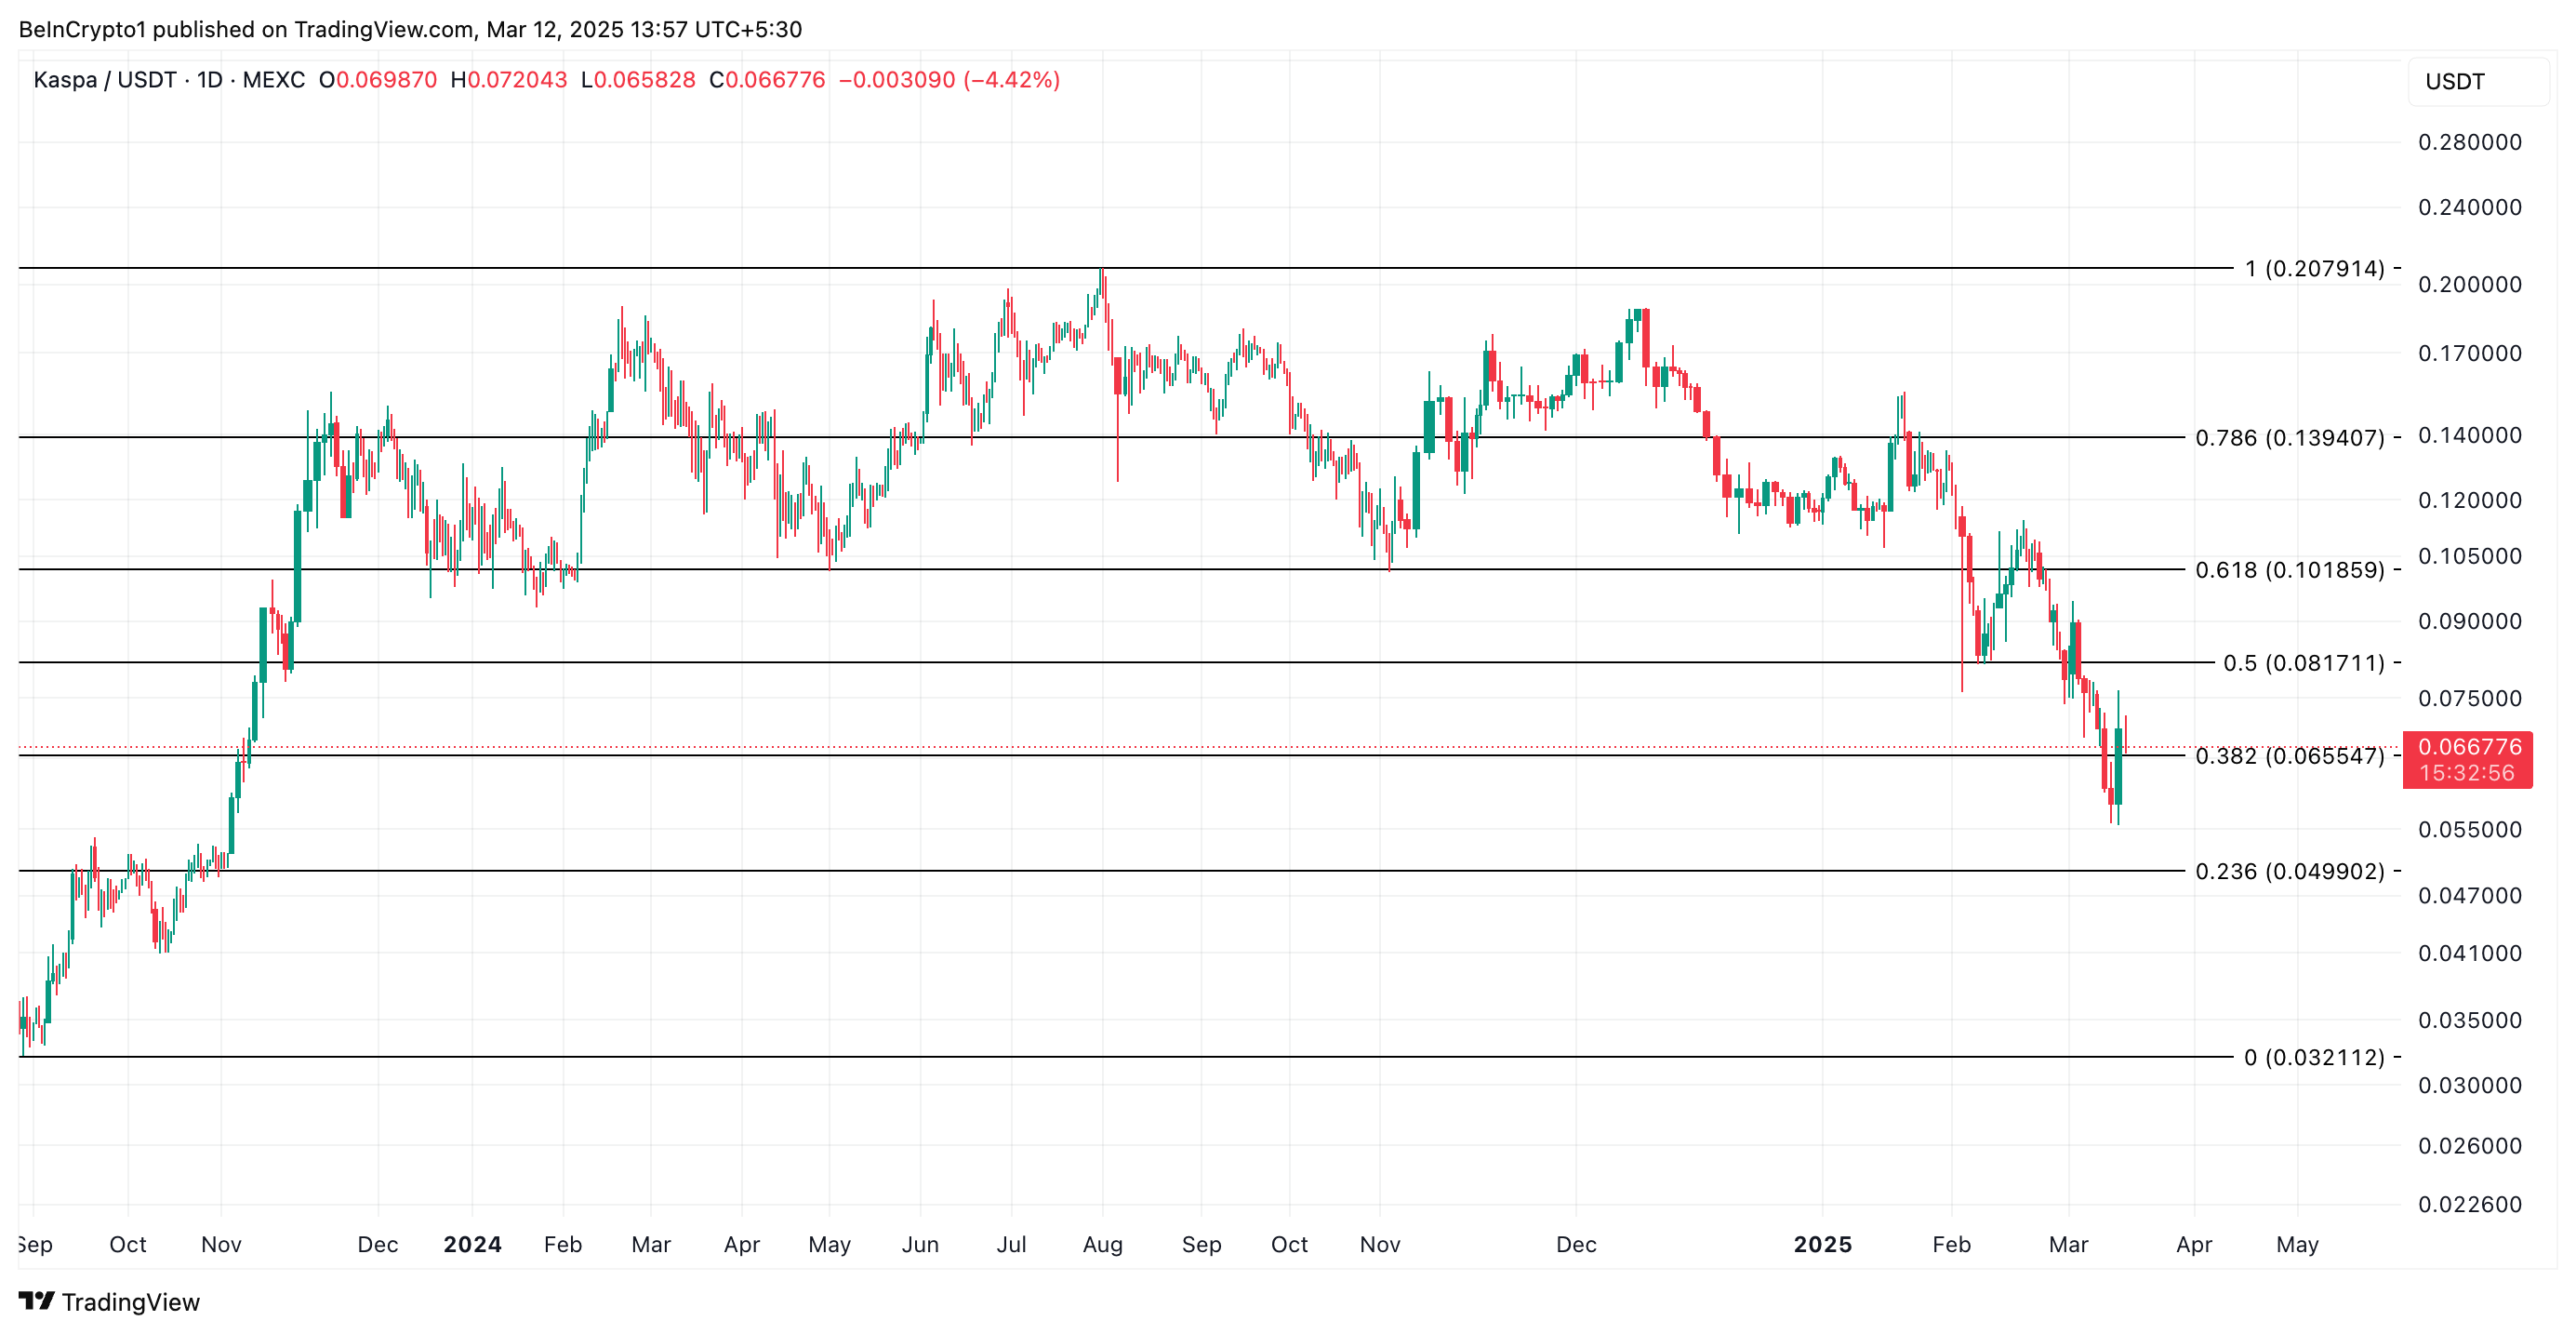 KAS Price Analysis. Source:
TradingView
On the other hand, if selling pressure gains momentum, KAS could shed its recent gains and fall below the $0.065 support toward $0.049.
Disclaimer: The content of this article solely reflects the author's opinion and does not represent the platform in any capacity. This article is not intended to serve as a reference for making investment decisions.
You may also like
After announcing its performance, AppLovin (APP.US), the leading player in "AI + digital advertising," surged 50%! Citigroup bets the rally isn't over, targeting $500 and new opportunities in e-commerce
While tech stocks faced sell-offs, AppLovin stood out by delivering profit-driven gains. On November 5, the Nasdaq 100 Index dropped 6.36% and the Philadelphia Semiconductor Index plunged 12.25%, yet AppLovin surged 31.04% after its earnings report. The stock continued to rise over the next two trading days, closing at $410 on November 9, marking an approximate 50.9% increase since its earnings announcement.
Confidence at Zero! Goldman Sachs Interprets Hedge Fund Positions: "Capitulation Liquidation," Largest Loss Since the Pandemic
Goldman Sachs' prime brokerage data reveals that hedge funds’ net leverage rate plummeted last week to the lowest percentile in five years, with the scale of deleveraging reaching the highest level since the March 2020 pandemic. The long-short ratio hit a five-year low. Tech stocks saw net selling of over $30 billion, far exceeding the turbulence in July. CTA quantitative strategies are expected to continue selling regardless of market movements in the coming week, with maximum selling pressure potentially reaching $48.7 billion. Currently, only mutual funds and corporate buybacks are providing counterflow liquidity, and a true market bottom may require further clearing of quantitative selling pressure.

New Zealand Dollar steadies as Iran talks fails to lift NZD/USD
Crypto prices
More


