Bitget App
Trade smarter
Buy cryptoMarketsTradeFuturesStocksEarnInstitutionAI & More
Ethereum Whale Liquidation Sparks Sell-Off as ETH Dips Below $1,800

Ethereum Whale Liquidation Sparks Sell-Off as ETH Dips Below $1,800

CryptoFrontNewsCryptoFrontNews2025/03/11 16:00
By:Timothy Munene

Ethereum’s price drop below $1,800 triggered a major whale liquidation, amplifying market selling pressure. ETH’s declining price from December 2024 to March 2025 led to reduced open interest, signaling waning trader engagement. The ETH/BTC pair is in a re-accumulation phase, hinting at a potential breakout towards 0.14 BTC in 2025.

  • Ethereum’s price drop below $1,800 triggered a major whale liquidation, amplifying market selling pressure.
  • ETH’s declining price from December 2024 to March 2025 led to reduced open interest, signaling waning trader engagement.
  • The ETH/BTC pair is in a re-accumulation phase, hinting at a potential breakout towards 0.14 BTC in 2025.

According to Lookonchain , Ethereum’s current price drop below $1,800 has triggered the liquidation of a whale who had 67,675 ETH valued at $121.8 million. Despite the efforts to prevent liquidation by adding 2,000 ETH ($3.73M) and repaying 1.54 million DAI, the price still dropped below the level of $1,836.43. 

Ethereum’s Price Action and Open Interest Decline

Besides the liquidation concerns, Data from Santiment shows Ethereum price movements from September 2024 to March 2025. The ETH price followed a strong upward trajectory from mid-September, peaking in early December before entering a decline in January. By March 12, 2025, the price had dropped to approximately $1,949, reflecting bearish sentiment.

Ethereum Whale Liquidation Sparks Sell-Off as ETH Dips Below $1,800 image 0 Ethereum Whale Liquidation Sparks Sell-Off as ETH Dips Below $1,800 image 1 Source: Santiment

Additionally, open interest in USD per exchange for ETH followed a similar pattern. It surged from mid-October, peaked in December, and then declined alongside Ethereum’s price. By March 12, open interest had fallen to around $3.51 billion, signifying reduced market engagement. Total open interest in USD also mirrored these fluctuations, reaching approximately $7.77 billion on the same date.

Hence, the correlation between ETH price and open interest is apparent. The rising price led to higher open interest, reflecting high trading activity. However, the falling price led to a drop in open interest, signaling declining trader interest. The market volatility between December 2024 and March 2025 fueled this trend, reducing open interest.

ETH/BTC Pair Poised for a Major Breakout

As per analyst Merlijn The Trader information, patterns suggest a move for the ETH/BTC trading pair. Since 2015, Ethereum has experienced multiple accumulation and re-accumulation phases, leading to sharp breakouts. 
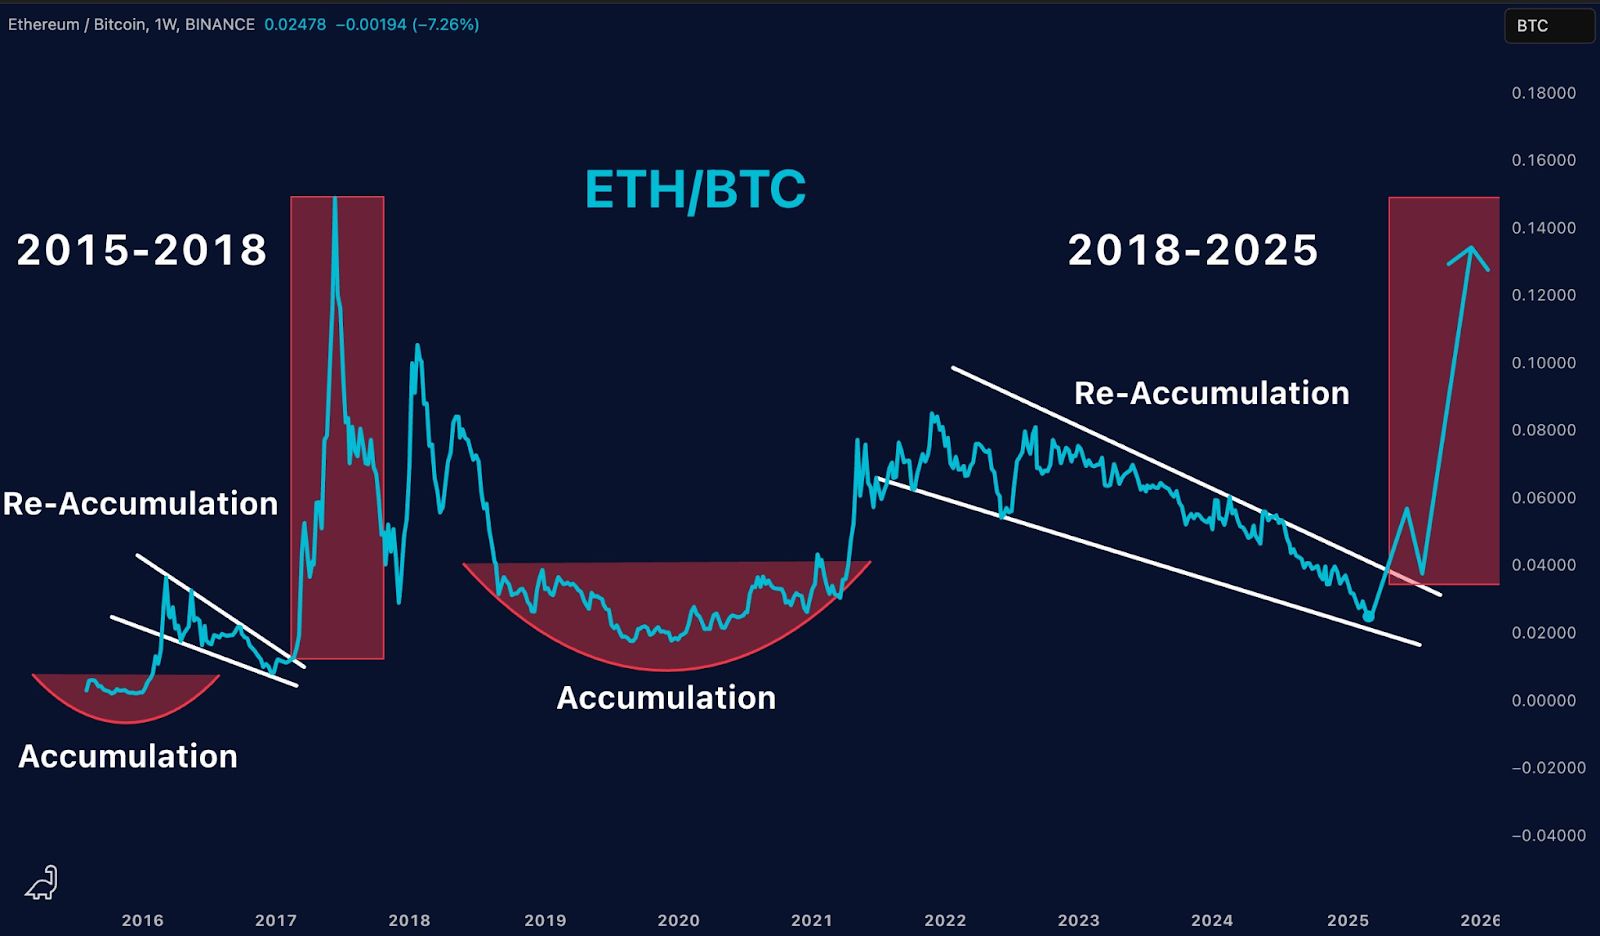
Ethereum Whale Liquidation Sparks Sell-Off as ETH Dips Below $1,800 image 2 Ethereum Whale Liquidation Sparks Sell-Off as ETH Dips Below $1,800 image 3 Source: Merlijn

The ETH/BTC emerged at a lower end in 2017 and went all the way up to 0.14 BTC, after which it fell into a prolonged phase of accumulation from 2018 to 2021. The current ETH/BTC pair is once again in another re-accumulation phase , following a descending channel since mid-2022; this trend now further suggest approaching breakout just as the year 2017 did.

DISCLAIMER: The information on this website is provided as general market commentary and does not constitute investment advice. We encourage you to do your own research before investing.


0
0

Disclaimer: The content of this article solely reflects the author's opinion and does not represent the platform in any capacity. This article is not intended to serve as a reference for making investment decisions.

Understand the market, then trade.
Bitget offers one-stop trading for cryptocurrencies, stocks, and gold.
Trade now!

You may also like

After announcing its performance, AppLovin (APP.US), the leading player in "AI + digital advertising," surged 50%! Citigroup bets the rally isn't over, targeting $500 and new opportunities in e-commerce

While tech stocks faced sell-offs, AppLovin stood out by delivering profit-driven gains. On November 5, the Nasdaq 100 Index dropped 6.36% and the Philadelphia Semiconductor Index plunged 12.25%, yet AppLovin surged 31.04% after its earnings report. The stock continued to rise over the next two trading days, closing at $410 on November 9, marking an approximate 50.9% increase since its earnings announcement.

智通财经•2026/11/10 02:57
After announcing its performance, AppLovin (APP.US), the leading player in "AI + digital advertising," surged 50%! Citigroup bets the rally isn't over, targeting $500 and new opportunities in e-commerce

Confidence at Zero! Goldman Sachs Interprets Hedge Fund Positions: "Capitulation Liquidation," Largest Loss Since the Pandemic

Goldman Sachs' prime brokerage data reveals that hedge funds’ net leverage rate plummeted last week to the lowest percentile in five years, with the scale of deleveraging reaching the highest level since the March 2020 pandemic. The long-short ratio hit a five-year low. Tech stocks saw net selling of over $30 billion, far exceeding the turbulence in July. CTA quantitative strategies are expected to continue selling regardless of market movements in the coming week, with maximum selling pressure potentially reaching $48.7 billion. Currently, only mutual funds and corporate buybacks are providing counterflow liquidity, and a true market bottom may require further clearing of quantitative selling pressure.

华尔街见闻•2026/11/10 02:52
Confidence at Zero! Goldman Sachs Interprets Hedge Fund Positions: "Capitulation Liquidation," Largest Loss Since the Pandemic