Bitget App
Trade smarter
Buy cryptoMarketsTradeFuturesStocksEarnInstitutionAI & More
Top RWA Token OM and ONDO Testing Key Support – Is It Time to Accumulate the Dip?

Top RWA Token OM and ONDO Testing Key Support – Is It Time to Accumulate the Dip?

CoinsProbeCoinsProbe2025/03/11 07:00
By:Nilesh Hembade

Date: Tue, March 11, 2025 | 04:10 AM GMT

The cryptocurrency market continues its strong downtrend, which began after the late 2024 rallies. In the past 24 hours, Ethereum (ETH) has dropped over 10%, plummeting from its December high of $4,000 to its current level of $1,850, adding immense pressure across the major altcoins .

Amid this bearish momentum, two top Real World Asset (RWA) tokens, Mantra (OM) and Ondo (ONDO), have been pulled down to test key support levels. While OM maintains resilience, trading in green, ONDO has suffered a sharp 9% drop.
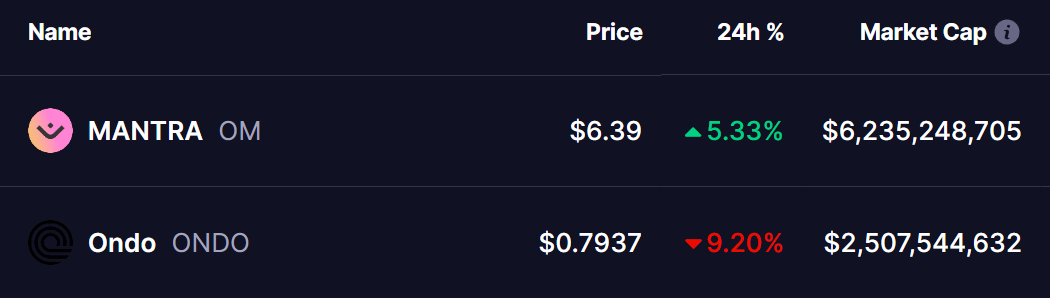
Top RWA Token OM and ONDO Testing Key Support – Is It Time to Accumulate the Dip? image 0 Source: Coinmarketcap

Mantra (OM)

On the daily chart of OM, today’s drop pushed its price down to test the 50-day Moving Average (50MA) support (marked in green circle) as well as the ascending trendline support. However, OM has shown resilience and is currently trading above this level at $6.38.
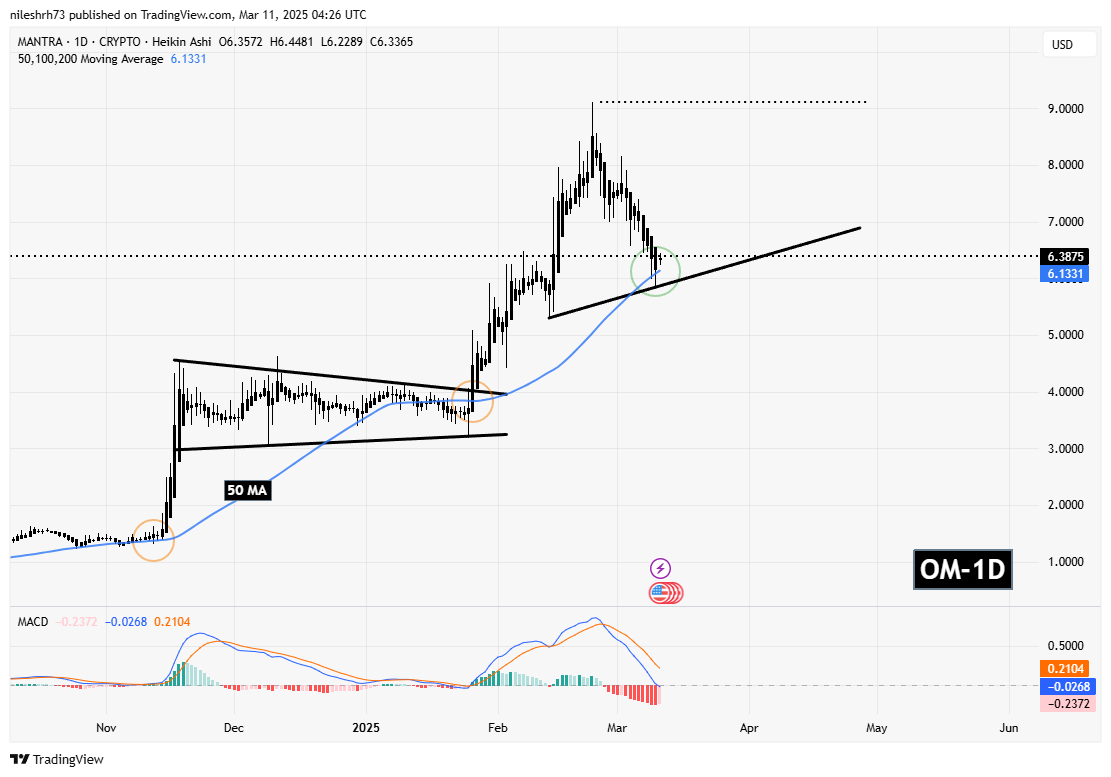
Top RWA Token OM and ONDO Testing Key Support – Is It Time to Accumulate the Dip? image 1 Mantra (OM) Daily Chart/Coinsprobe (Source: Tradingview)

Looking at historical price action, similar tests of the 50MA support (marked in orange circles) led to strong rebounds, fueling major rallies. If this pattern repeats, OM could aim for a retest of its recent all-time high (ATH) of $9.11, with possible consolidation ahead.

Ondo (ONDO)

On the other hand, ONDO’s weekly chart highlights an ascending broadening wedge pattern. The ongoing correction started after its rejection from the upper trendline at $2.14 (Dec 16 high), which triggered a steady downtrend towards the lower support trendline.
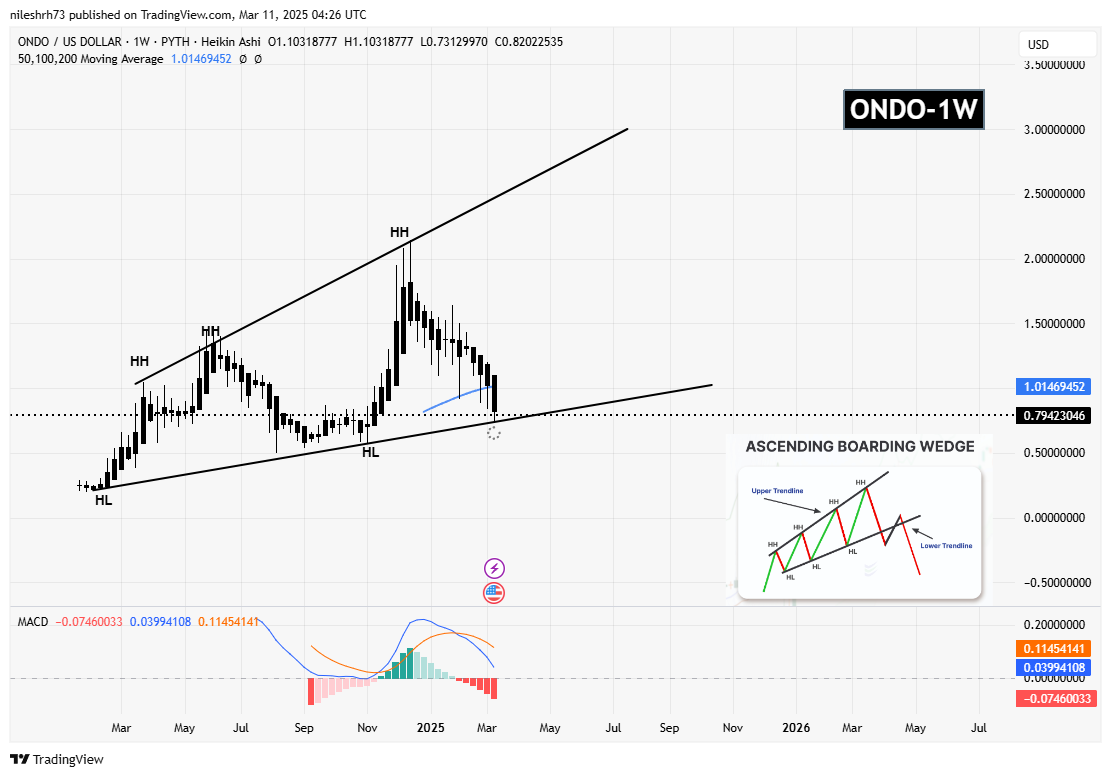
Top RWA Token OM and ONDO Testing Key Support – Is It Time to Accumulate the Dip? image 2 ONDO Weekly Chart/Coinsprobe (Source: Tradingview)

With today’s drop, ONDO has tested the lower trendline support at $0.73 and is now trading above it at $0.79, showing some resilience. If ONDO follows its historical price movement within the pattern, a strong recovery toward the upper trendline could be on the horizon.

Is It Time to Accumulate the Dip?

Both OM and ONDO are currently at critical support levels, historically known to trigger rebounds. If these supports hold, the risk-reward ratio for accumulation becomes highly favorable for traders looking for a potential bounce. However, a breakdown below these levels could signal further downside in the short term.

Investors should closely monitor macro market conditions, BTC’s movement, and volume inflow to confirm a reversal before making decisions.

Disclaimer: This article is for informational purposes only and not financial advice. Always conduct your own research before investing in cryptocurrencies.


0
0

Disclaimer: The content of this article solely reflects the author's opinion and does not represent the platform in any capacity. This article is not intended to serve as a reference for making investment decisions.

Understand the market, then trade.
Bitget offers one-stop trading for cryptocurrencies, stocks, and gold.
Trade now!

You may also like

After announcing its performance, AppLovin (APP.US), the leading player in "AI + digital advertising," surged 50%! Citigroup bets the rally isn't over, targeting $500 and new opportunities in e-commerce

While tech stocks faced sell-offs, AppLovin stood out by delivering profit-driven gains. On November 5, the Nasdaq 100 Index dropped 6.36% and the Philadelphia Semiconductor Index plunged 12.25%, yet AppLovin surged 31.04% after its earnings report. The stock continued to rise over the next two trading days, closing at $410 on November 9, marking an approximate 50.9% increase since its earnings announcement.

智通财经•2026/11/10 02:57
After announcing its performance, AppLovin (APP.US), the leading player in "AI + digital advertising," surged 50%! Citigroup bets the rally isn't over, targeting $500 and new opportunities in e-commerce

Confidence at Zero! Goldman Sachs Interprets Hedge Fund Positions: "Capitulation Liquidation," Largest Loss Since the Pandemic

Goldman Sachs' prime brokerage data reveals that hedge funds’ net leverage rate plummeted last week to the lowest percentile in five years, with the scale of deleveraging reaching the highest level since the March 2020 pandemic. The long-short ratio hit a five-year low. Tech stocks saw net selling of over $30 billion, far exceeding the turbulence in July. CTA quantitative strategies are expected to continue selling regardless of market movements in the coming week, with maximum selling pressure potentially reaching $48.7 billion. Currently, only mutual funds and corporate buybacks are providing counterflow liquidity, and a true market bottom may require further clearing of quantitative selling pressure.

华尔街见闻•2026/11/10 02:52
Confidence at Zero! Goldman Sachs Interprets Hedge Fund Positions: "Capitulation Liquidation," Largest Loss Since the Pandemic