Date: Mon, February 10, 2025 | 12:15 PM GMT
The cryptocurrency market has been under pressure recently, with Bitcoin’s rising dominance playing a significant role in pulling down altcoins . Since December, Bitcoin dominance has increased from 54.96% to 61.71%, leading to a major correction across the altcoin sector.
Amid this downturn, Sui (SUI)—a layer-1 blockchain that performed exceptionally well in late 2024—has seen a 36% decline in the past month.
 Source: Coinmarketcap
However, recent on-chain growth and price action suggests that SUI could be gearing up for a recovery.
On-Chain Growth
Despite the price decline, SUI has shown significant strength in its on-chain activity. According to crypto analyst Torero Romero , SUI has reached a total DEX volume of $60 billion, marking a 23.27% increase in the last 30 days.
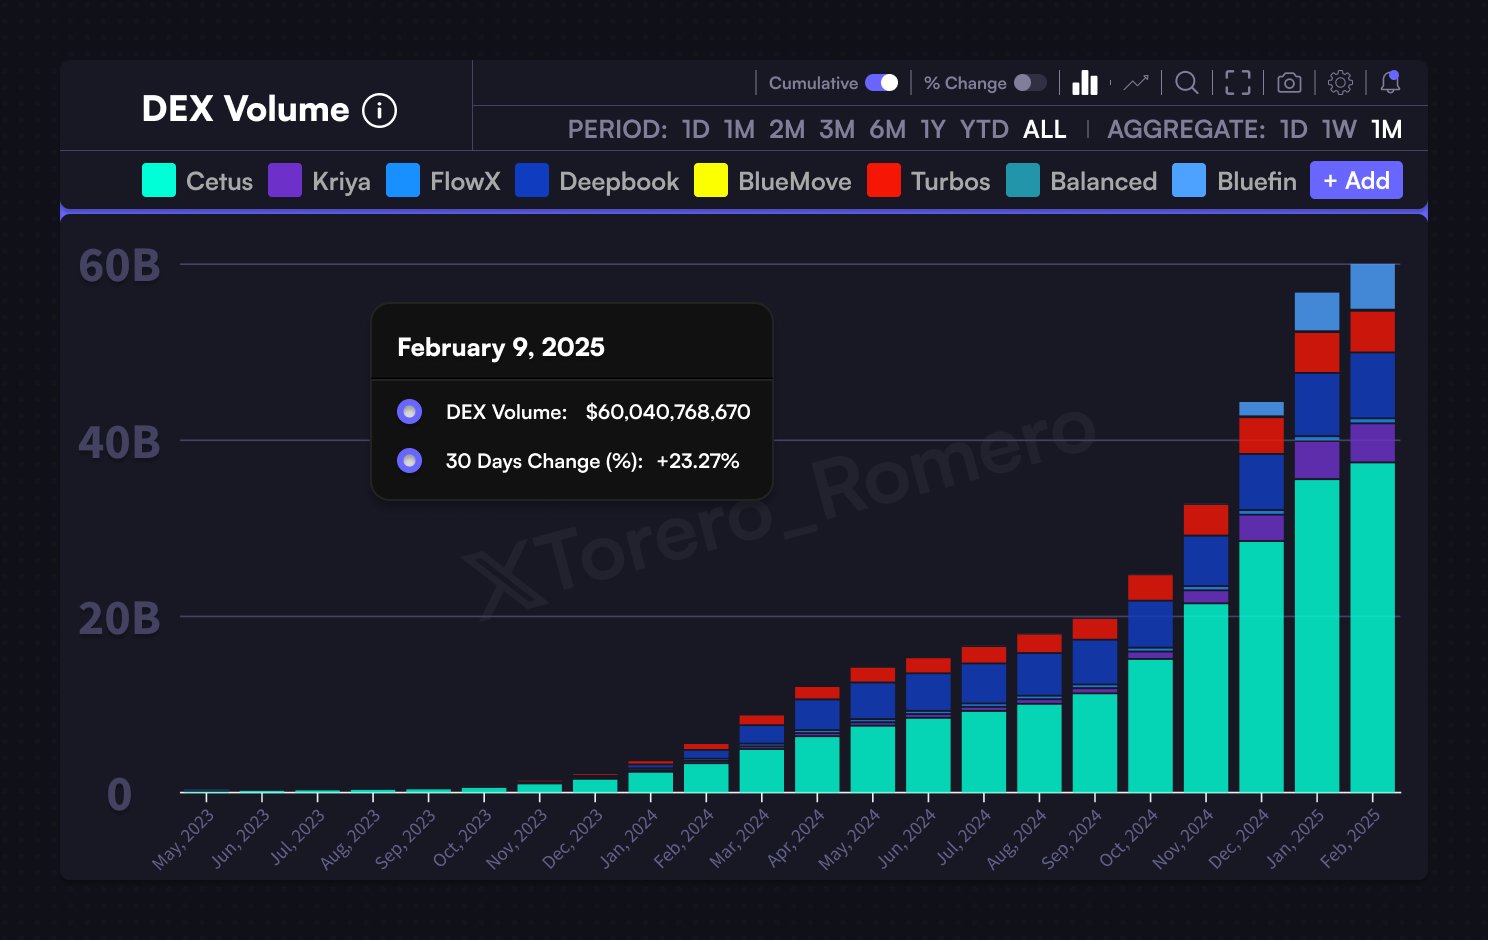 Source: @Torero_Romero (X)
This surge in volume highlights the growing adoption of the Sui ecosystem. Just a year ago, in February 2024, the total DEX volume was only around $5 billion—showcasing an over 10x increase in just one year.
Could This Breakout Spark a Recovery?
Looking at SUI’s daily chart, the token has been consolidating within a falling wedge pattern since rejecting its all-time high of $5.82 on January 6. After multiple support and resistance retests, the recent drop pushed SUI to a low of $2.50, where it found strong support at the 200-SMA.
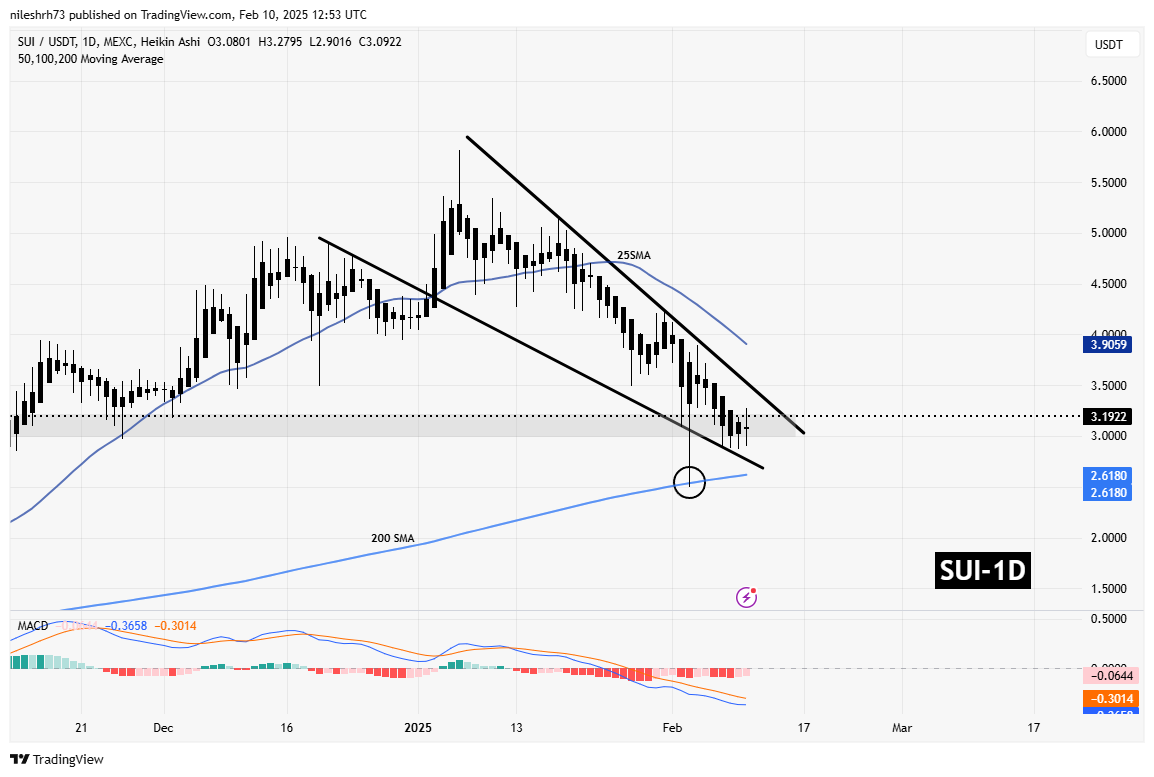 SUI Daily Chart/Coinsprobe (Source: Tradingview)
This led to a solid bounce, bringing the price back to its current level of $3.19, close to the upper resistance trendline of the wedge. The MACD is showing early signs of a bullish crossover, hinting at a potential momentum shift. If SUI successfully breaks out of the falling wedge, it will face initial resistance at the 25-SMA.
A strong push above this level could confirm a recovery rally, potentially sending the price toward the next resistance at $4.22.
Final Thoughts
SUI’s on-chain growth and technical support at key moving averages indicate a potential breakout. If bullish momentum continues, the token could soon resume its upward trajectory. However, traders should closely monitor Ethereum (ETH) movements and Bitcoin (BTC) dominance, as both factors could significantly influence SUI’s price action.
Disclaimer: This article is for informational purposes only and does not constitute financial advice. Always conduct your own research before investing in cryptocurrencies.