

Last updated: February 9, 2025 07:05 EST
Is There Still a Future for $TRUMP? Down Almost 20% This Week
By:Arslan Butt
Bitget offers one-stop trading for cryptocurrencies, stocks, and gold. Trade now!
A welcome pack worth 6200 USDT for new users! Sign up now!
Disclaimer: Crypto is a high-risk asset class. This article is provided for informational purposes and does not constitute investment advice. You could lose all of your capital.

$TRUMP has dropped 20% this past week, now trading at $17.00, as a wave of imitation tokens stirs confusion among investors. More than 700 lookalike coins have popped up, borrowing branding from Trump and his family, making it tough for traders to separate the real deal from potential scams.
With so many clones flooding the market, demand for $TRUMP has taken a hit, fueling price swings.
At first, the token gained traction, riding on speculation and Trump’s growing connection to crypto. But the rise of unauthorized versions on decentralized exchanges is sparking concerns about liquidity traps and market manipulation.
Many of these knockoff coins lack real utility, depending on hype and artificial trading volume to stay afloat—raising the risk of sharp sell-offs.
$TRUMP Token Faces Resistance at $17.95
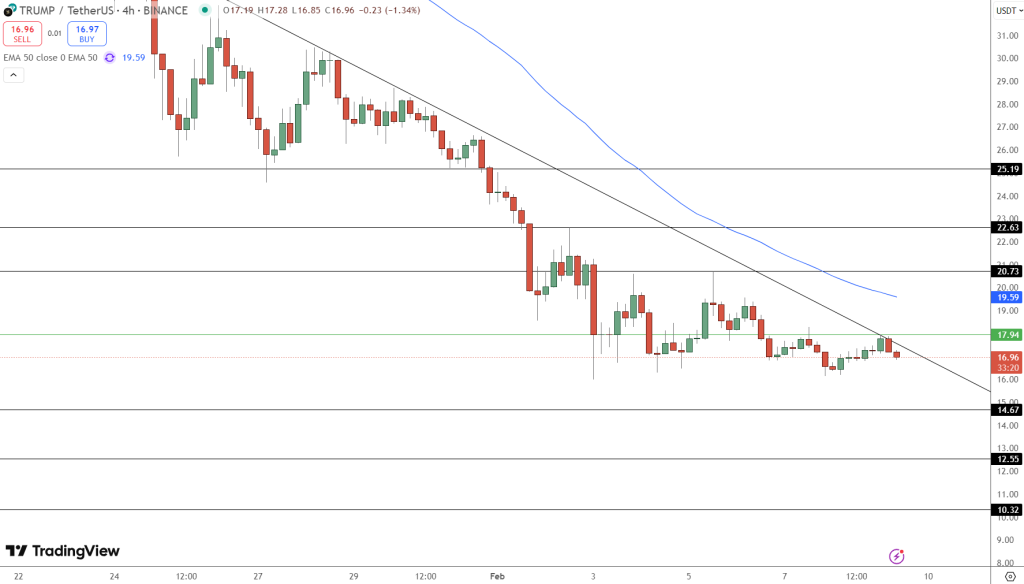
Despite brief recovery attempts, $TRUMP remains below its key resistance level of $17.95, aligning with a descending trendline that has rejected multiple bullish breakouts. The 50-day Exponential Moving Average (EMA) at $19.59 reinforces this ceiling, preventing any sustained recovery.
To reverse momentum, $TRUMP must break and hold above $17.95. A breakout could push the price toward $20.73 and $22.63, but failing to clear resistance could leave the token vulnerable to another downward leg.
Will $TRUMP Hold Above $14.67? Key Support Levels to Watch
The next major test lies at $14.67, a key support zone that has previously held against sharp declines. If this level breaks, $TRUMP could slide further toward $12.55 and $10.32—historically significant levels where buyers might step in.
For $TRUMP to stabilize, bulls must defend the $14.67 support, while a break above $17.95 could attract fresh buyers. If sellers maintain control, however, further losses may be inevitable.
$Trump Market Outlook: Speculation or Long-Term Viability?
Trump’s endorsement of cryptocurrency has kept the $TRUMP token in focus, but its price action remains driven by speculation rather than fundamentals. While political narratives have influenced its trajectory, the token must establish stronger technical support to sustain long-term value.
For now, the market remains cautious, watching whether $TRUMP can break past resistance at $17.95 or if further declines are on the horizon.
0
0
Disclaimer: The content of this article solely reflects the author's opinion and does not represent the platform in any capacity. This article is not intended to serve as a reference for making investment decisions.
Understand the market, then trade.
Bitget offers one-stop trading for cryptocurrencies, stocks, and gold.
Trade now!
You may also like
US Data Center Regulation Tightening Hits AI Infrastructure Stocks? Morgan Stanley: Limited Impact in 2027, Risks More Concentrated in 2028
Morgan Stanley believes that the sell-off of AI infrastructure stocks triggered by the U.S. midterm elections may be an overreaction. The risk of data center expansion in 2027 is limited, AI computing power demand remains strong, and some tech stocks are already showing investment opportunities, with Microsoft still being the top pick.
智通财经•2026/11/09 16:15

Investor in UXLINK-linked wallet starts closing $148 million Hyperliquid positions
Cointurk•2026/11/09 15:42

Grayscale and a16z Flag AI Compute as the Next Major Derivatives Market
Coinsprobe•2026/11/09 14:42

Goldman Sachs Identifies Key Trend Lines; Nasdaq's Last Line of Defense Is in Jeopardy
The Nasdaq 100 Index has declined for four consecutive weeks and is currently testing a key trend line connecting the 2025 and 2026 lows at 26,630 points. Despite strong third-quarter earnings, heightened risk aversion and surging panic indicators have led investors to factor in potential slowdown expectations for 2028, causing stock prices to continue falling. With significant outflows of foreign capital and sharp valuation divergences, the market is awaiting the test of this week's CPI data and chip giant earnings reports.
华尔街见闻•2026/11/09 13:36

Crypto prices
More
Bitcoin
BTC
$74,848.34
-1.38%

Ethereum
ETH
$2,128.1
-4.78%

Tether USDt
USDT
$0.9989
+0.03%

BNB
BNB
$686.81
-1.49%

USDC
USDC
$0.9998
+0.01%

XRP
XRP
$1.1
-4.79%

Solana
SOL
$86.82
-2.75%

TRON
TRX
$0.3174
-0.85%

Zcash
ZEC
$1,178.84
-5.93%

Hyperliquid
HYPE
$74.78
-2.96%
How to buy BTC
Bitget lists BTC – Buy or sell BTC quickly on Bitget!
Trade now
Become a trader now?A welcome pack worth 6200 USDT for new users!
Sign up now