Date: Thu, Jan 16, 2025, 07:36 AM GMT
The cryptocurrency market has shown notable bullish momentum in the past 24 hours following a positive reaction to the U.S. CPI report for December 2024. Bitcoin surged above $99,000 mark, propelled by lower-than-expected core inflation figures. Alongside this, Bitcoin dominance declined to 57.74%, creating an environment favorable for altcoins .
Among these, Axie Infinity (AXS) and Enjin (ENJ) are coming into the spotlight with noticeable gains and are approaching critical breakout levels, signaling a potential continuation of the rally.
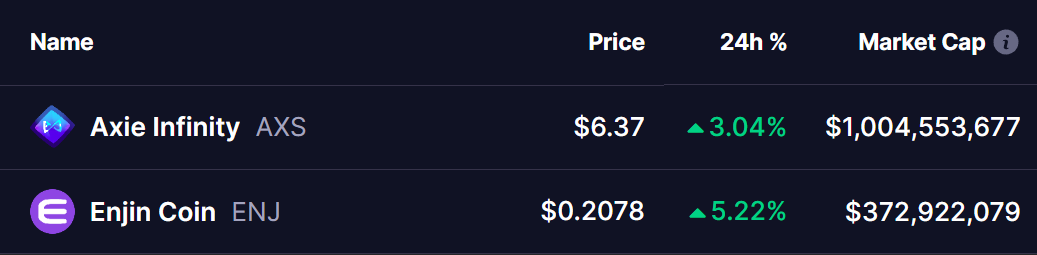 Source: Coinmarketcap
Axie Infinity (AXS)
Axie Infinity (AXS) is currently trading at $6.36 and is testing the upper boundary of a descending triangle pattern. This resistance level aligns with a key horizontal zone near $6.55, making it a critical point for the token’s next move. After weeks of consolidation within this formation, AXS has regained upward momentum, driven by a rebound from the 200-day Moving Average (MA). This recent surge has brought the token to a pivotal moment, where a breakout could signal a major trend reversal.
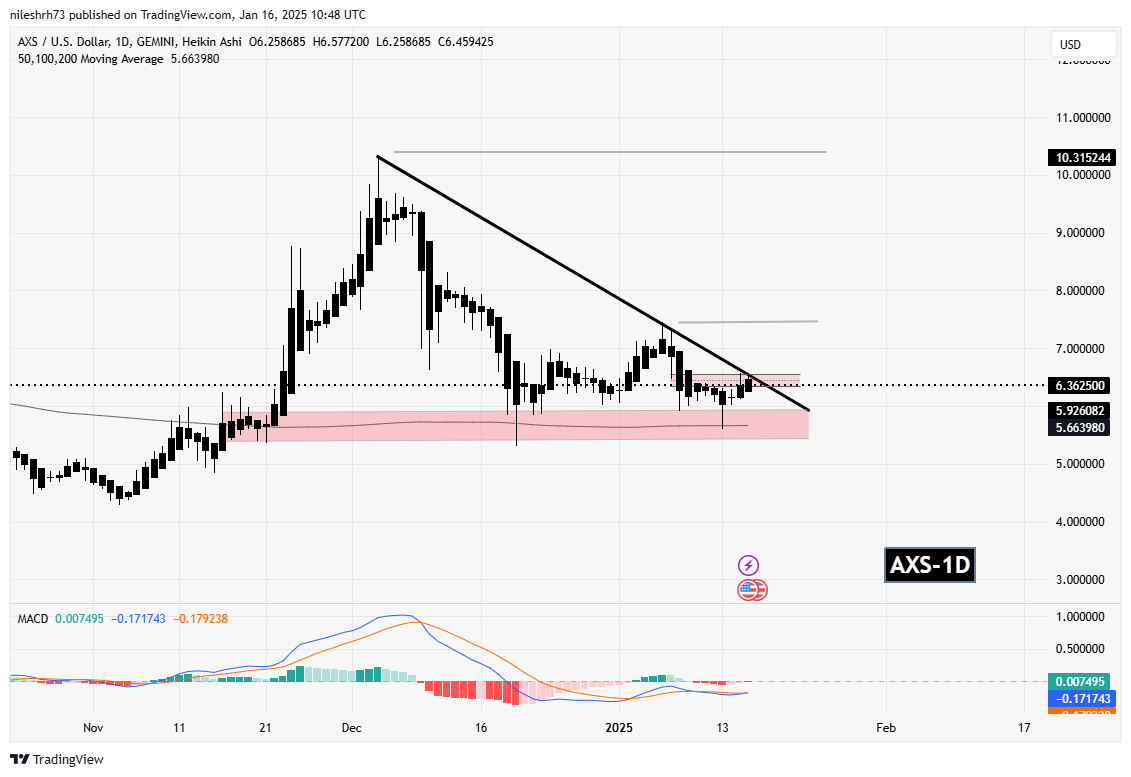 Axie Infinity (AXS) 1D Chart / Coinsprobe (Source: Tradingview)
If AXS manages to break above this key resistance—formed by the convergence of the trendline and horizontal levels—it could pave the way for a substantial rally. Potential targets include $7.45 and $10.34, representing an impressive upside of up to 61% from its current price.
Technically, the Moving Average Convergence Divergence (MACD) indicator is showing signs of bullish momentum, with a potential crossover hinting at further gains. Additionally, the increasing volume profile reflects growing interest from buyers as AXS nears its resistance zone.
Enjin (ENJ)
Enjin (ENJ) is trading at $0.208 and is also at the brink of a breakout from a descending triangle pattern. Like AXS, ENJ has been consolidating for weeks, but its recent recovery from the 200-day Moving Average (MA) has driven it close to a critical resistance line.
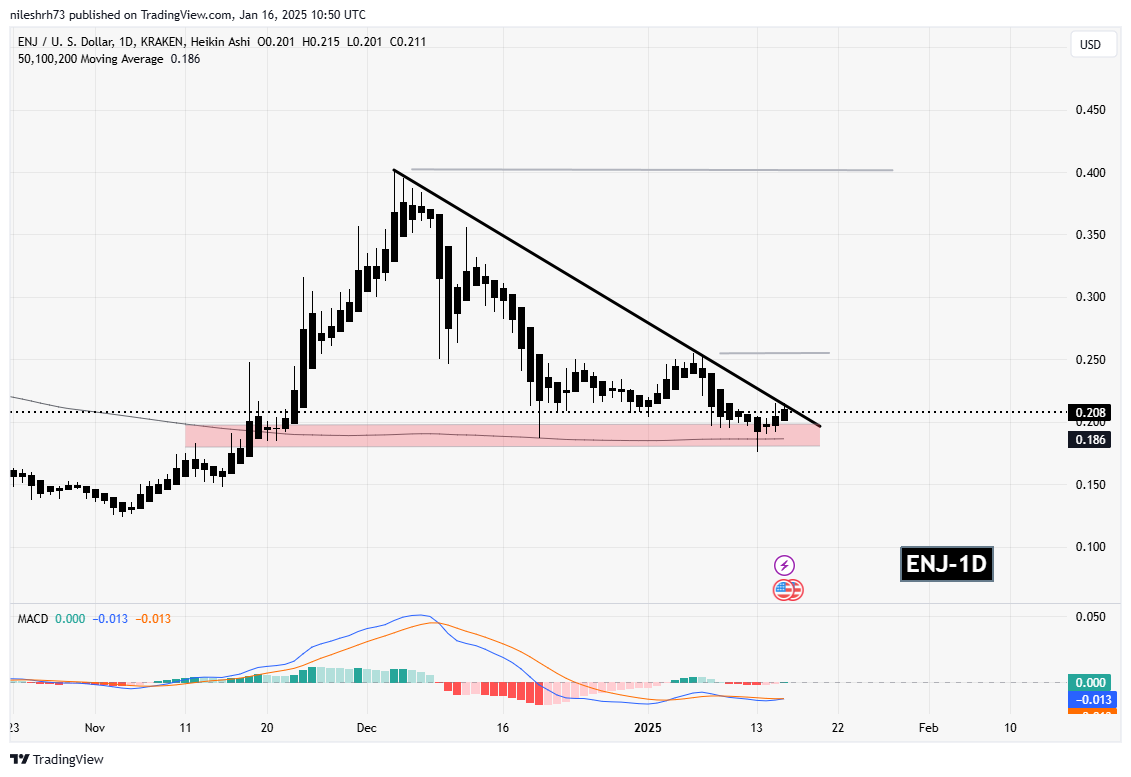 Enjin (ENJ) 1D Chart / Coinsprobe (Source: Tradingview)
If ENJ manages to break above this level, it could potentially rally to higher price targets. The next significant levels lie at $0.2968 and $0.4291, offering a possible upside of 71% from the current price.
On the technical side, the MACD for ENJ also signals a bullish crossover, indicating growing momentum. Increased trading volume further supports the possibility of a strong upward move.
Are Breakouts On The Horizon?
The broader cryptocurrency market’s positive sentiment following the U.S. CPI report has provided the perfect foundation for these potential breakouts. Both Axie Infinity and Enjin are demonstrating resilience and strength as they approach crucial levels, and the technical indicators suggest that upward moves could be imminent.
If market conditions remain favorable, these gaming tokens could lead a new wave of altcoin rallies in the coming days. However, the next steps will depend heavily on whether buyers can sustain momentum and push through the resistance levels.
The market outlook remains positive for AXS and ENJ, but traders and investors should remain cautious. Watching volume and momentum indicators closely will be key to gauging the strength of any breakout.
Disclaimer:
This article is for informational purposes only and not financial advice. Always conduct your own research before investing in cryptocurrencies.