Bitget App
Trade smarter
Buy cryptoMarketsTradeFuturesStocksEarnInstitutionAI & More
On-chain analyst TechDev: Bitcoin RSI channel history reappears, new cycle signals emerge clearly
On-chain analyst TechDev: Bitcoin RSI channel history reappears, new cycle signals emerge clearly

TechDev2024/12/23 03:45
By:TechDev
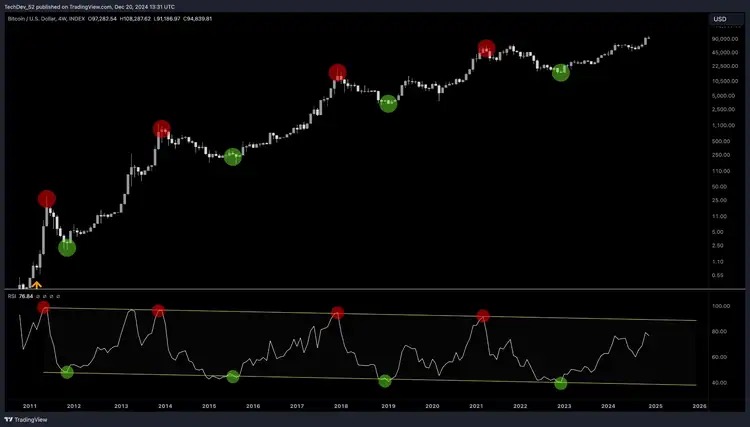
The latest Bitcoin price and RSI channel analysis chart released by on-chain analyst TechDev shows that since 2011, the RSI indicator has been running in a long-term downward channel, clearly revealing the inflection point pattern of market tops and bottoms.
 
From the chart, the top area of the RSI marked in red accurately captures the bull market peaks of 2013, 2017, and 2021, all of which occurred when the RSI touched the upper track of the channel; the bottom marked in green perfectly corresponds to the bear market lows of 2015, 2018, and 2023, which occurred when the RSI touched the lower track of the channel.
 
TechDev pointed out that the RSI is gradually rising and there is still some room for improvement from the top of the channel, indicating that the market may be in the middle stage of a bull market. This revalidation of cyclical patterns provides a strong reference for the Bitcoin after-market.
 
TechDev further explains: "The price cycle of the Bitcoin market and the changes in RSI are core tools for understanding long-term trends. As RSI steadily rises, market sentiment may further recover." However, he also reminds that although the RSI channel provides important cyclical signals, external macro environment and market volatility factors cannot be ignored.
On-chain analyst TechDev: Bitcoin RSI channel history reappears, new cycle signals emerge clearly image 0
0
2

Disclaimer: The content of this article solely reflects the author's opinion and does not represent the platform in any capacity. This article is not intended to serve as a reference for making investment decisions.

Understand the market, then trade.
Bitget offers one-stop trading for cryptocurrencies, stocks, and gold.
Trade now!

You may also like

Midterm elections expose market vulnerability! AI trading faces rigorous scrutiny, U.S. stock earnings expectations may undergo major adjustments

The results of the US midterm elections and the subsequent market crash have exposed the vulnerability caused by the market’s excessive concentration of bets on artificial intelligence (AI). Investors may need to readjust their expectations for investment returns.

智通财经•2026/11/09 10:59
Midterm elections expose market vulnerability! AI trading faces rigorous scrutiny, U.S. stock earnings expectations may undergo major adjustments

SpaceX unlock wave meets index rebalancing! Goldman Sachs estimates: December rebalancing may bring $10.9 billion in passive buying

The proportion of SpaceX's freely tradable shares has increased from about 5% at the time of its IPO to one-third, and the expansion of index weightings is driving passive funds to increase their holdings. According to Goldman Sachs, the rebalancing of the Russell 1000 Growth Index on December 11 may trigger $10.9 billion in buy orders, with the main counterparts being insiders whose shares are unlocked. The S&P 500 inclusion window points to the second half of 2027, when the competition among passive funds will further intensify.

华尔街见闻•2026/11/09 10:46

Citigroup Q3 Holdings: Nvidia (NVDA.US) Remains Top Heavy Position, Expanded Both Index and Tech Stock Options

According to the disclosure by the U.S. Securities and Exchange Commission (SEC), Citigroup (C.US) submitted its third quarter holdings report (13F) as of September 30, 2026, on November 4, 2026.

智通财经•2026/11/09 09:18
Citigroup Q3 Holdings: Nvidia (NVDA.US) Remains Top Heavy Position, Expanded Both Index and Tech Stock Options