Bitget App
Trade smarter
Buy cryptoMarketsTradeFuturesStocksEarnInstitutionAI & More
Bitcoin daily RSI hits 4-month lows with BTC price still up 70%

Bitcoin daily RSI hits 4-month lows with BTC price still up 70%

CointelegraphCointelegraph2024/01/16 08:11
By:William Suberg

Bitcoin ( BTC ) is rapidly headed for “oversold” territory despite still trading above $40,000, the latest data shows.

As noted by analyst Matthew Hyland on Jan. 14, Bitcoin’s relative strength index ( RSI ) hit its lowest levels since September this week.

BTC price RSI echoes $25,000 levels

BTC price performance suffered a 15% drop after the launch of the United States’ first spot Bitcoin exchange-traded funds (ETFs) — and has so far struggled to bounce back .

As traders warn of the risk of further downside, RSI is showing that a reversal may already be near.

On daily timeframes, the classic momentum oscillator dipped to 42.7/100 on Jan. 14 — lower than at any point in the last four months, as confirmed by data from Cointelegraph markets Pro and TradingView .

At the time, BTC/USD traded at around $25,000.
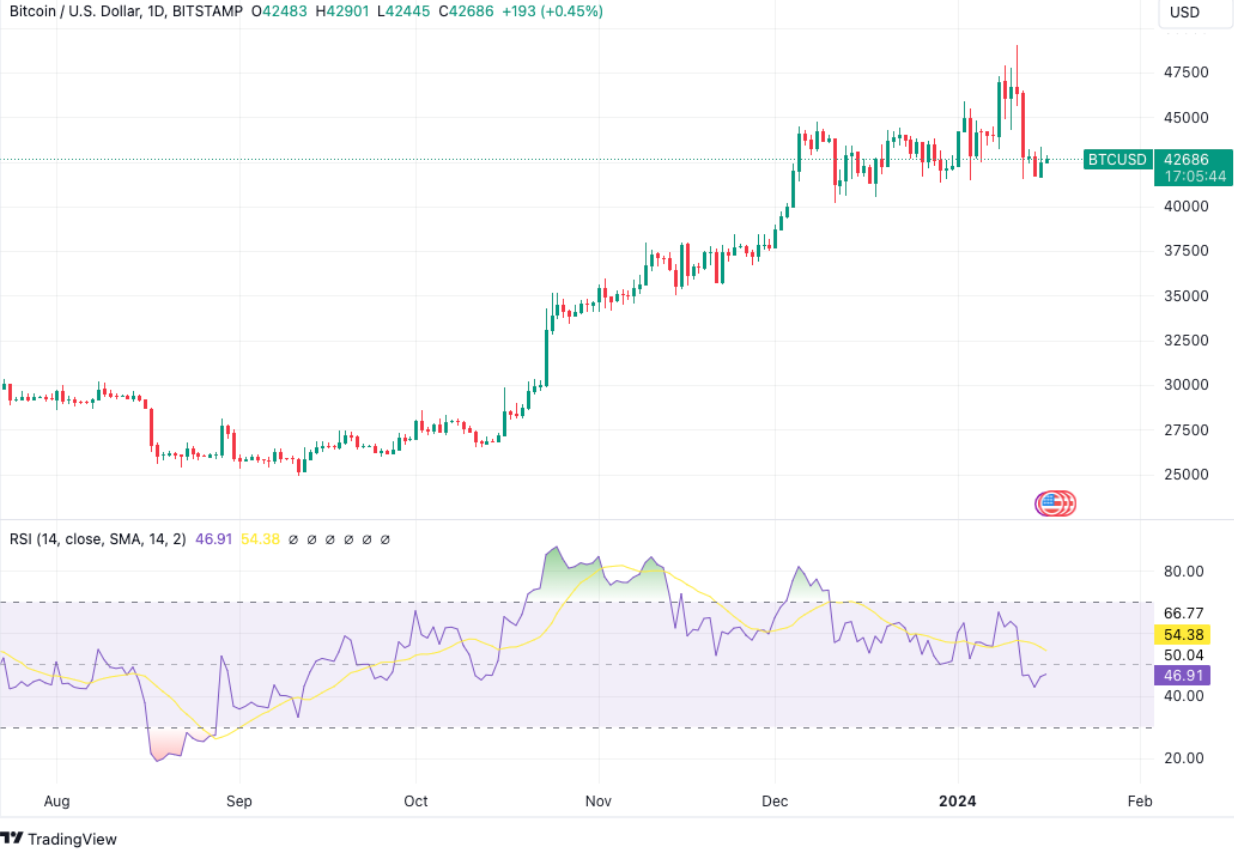
Bitcoin daily RSI hits 4-month lows with BTC price still up 70% image 0

BTC/USD 1-day chart with RSI data. Source: TradingView

The move was not lost on Hyland, who uploaded a chart to X (formerly Twitter) which suggested a hidden bearish divergence playing out — RSI making lower lows while Bitcoin itself makes higher lows.

#BTC Daily RSI lower that October lows and at lowest levels since September: pic.twitter.com/lwPnkrhkUh

— Matthew Hyland (@MatthewHyland_) January 16, 2024

Daily RSI is nonetheless not strictly indicative of an imminent return to form for BTC price strength.

Having sunk below the midpoint of 50/100, the metric’s next major test could be the barrier to its “oversold” area at 30/100.

“I would like to see the Daily RSI go down to Oversold for Bitcoin,” popular trader and social media commentator Seth wrote in part of a recent X post.
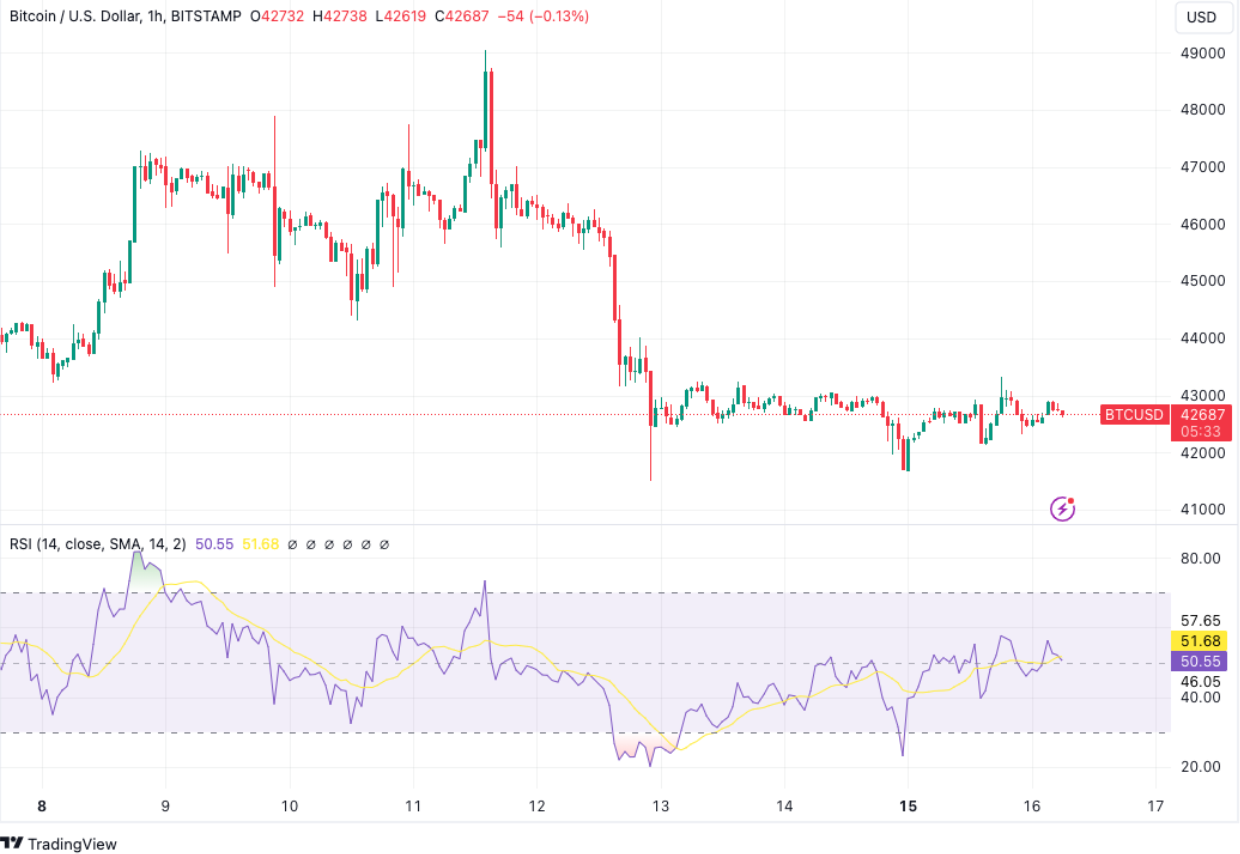
Bitcoin daily RSI hits 4-month lows with BTC price still up 70% image 1
BTC/USD 1-hour chart with RSI data. Source: TradingView

On hourly timeframes, RSI pierced the 30/100 line in the sand twice this week, both times recovering and making higher lows in the process.

Bollinger Bands reflect return of volatility

Last week, meanwhile, fellow trader Jelle meanwhile noted that by contrast, a trip back to “overbought” levels above 70 can often mark the start of the steepest upside on BTC/USD.

Related:  BTC speculators dump $5B — 5 things to know in Bitcoin this week

When #Bitcoin 's RSI enters the overbought territory, the real fun happens.

Just look at what happened in the past: pic.twitter.com/IAdXyOE3nU

— Jelle (@CryptoJelleNL) January 9, 2024

As Cointelegraph reported late last month, RSI is just one of several key metrics currently on the radar of market participants.

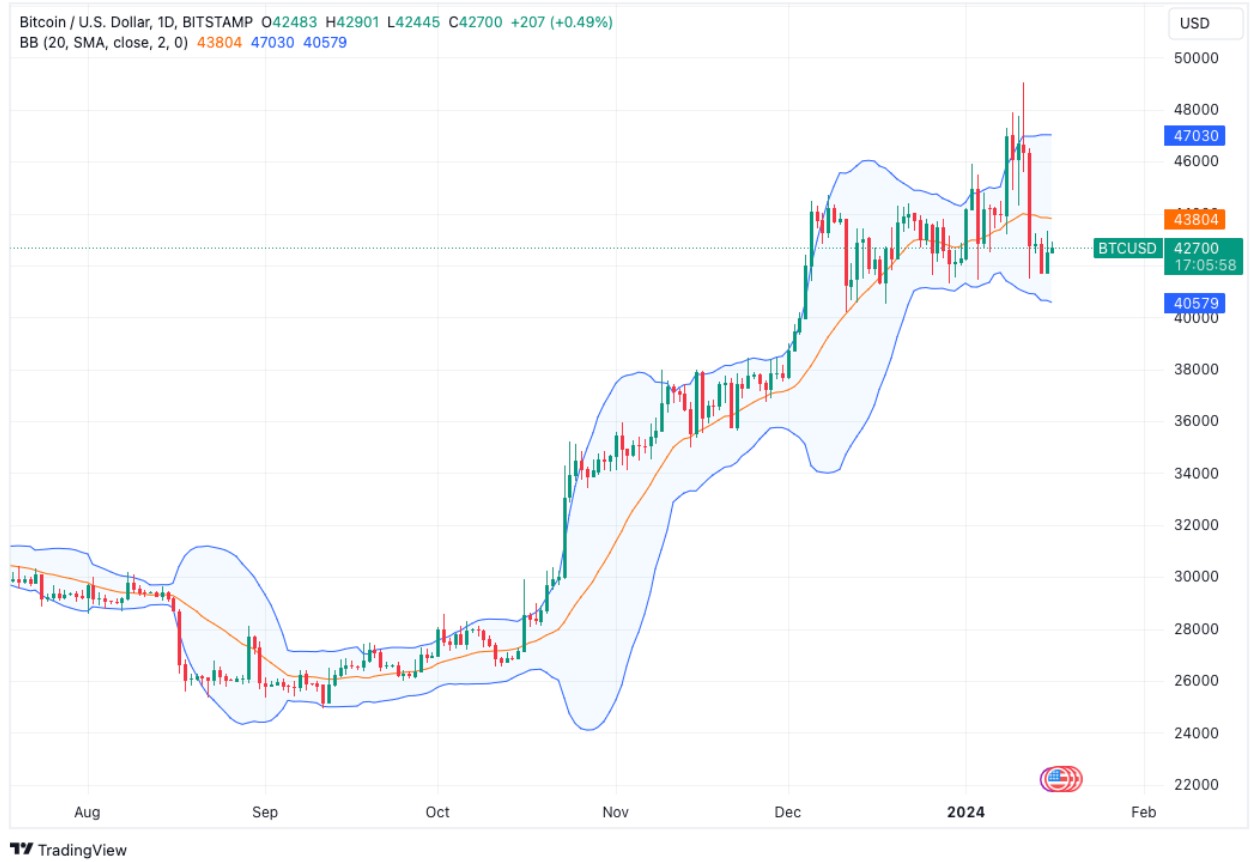
Another is the Bollinger Bands volatility indicator, the daily chart for which now shows BTC/USD back in volatile mode after a period of constriction.

Current prices mark a trip to near the bottom of the expanding channel, which has likewise not been truly challenged since mid-September.

Bitcoin daily RSI hits 4-month lows with BTC price still up 70% image 2

BTC/USD 1-day chart with Bollinger Bands data. Source: TradingView

This article does not contain investment advice or recommendations. Every investment and trading move involves risk, and readers should conduct their own research when making a decision.

0
0

Disclaimer: The content of this article solely reflects the author's opinion and does not represent the platform in any capacity. This article is not intended to serve as a reference for making investment decisions.

Understand the market, then trade.
Bitget offers one-stop trading for cryptocurrencies, stocks, and gold.
Trade now!

You may also like

Bank of Japan shifts to “anti-inflation” mode! Kazuo Ueda hints at further room for rate hikes, December move under watch

The Bank of Japan kept its policy rate unchanged at 1.25% on Friday, but Governor Kazuo Ueda's remarks at the post-meeting press conference sent policy signals that are more noteworthy than the rate decision itself.

智通财经•2026/10/30 08:59
Bank of Japan shifts to “anti-inflation” mode! Kazuo Ueda hints at further room for rate hikes, December move under watch

Betting Big on AI Burns Through Cash Cows—This Time, the Market No Longer "Rewards Burning Money"!

The AI spending race faces profitability scrutiny: Google’s search advertising growth rate has dropped to its lowest in five quarters, and Amazon’s single-quarter free cash flow has plunged to -$33.5 billion. Yet both companies continue with capital expenditure plans exceeding $400 billion. As their core cash-generating businesses lose momentum and debt and financing needs surge, the market is shifting from rewarding AI investment to questioning returns, forcing a re-evaluation of the valuation logic for tech giants.

华尔街见闻•2026/10/30 08:26
Betting Big on AI Burns Through Cash Cows—This Time, the Market No Longer "Rewards Burning Money"!

Wall Street Sees AWS’s Ambition, But Can’t See the Future of Amazon’s Advertising Business

Amazon's Q3 financial report presents a mixed picture: AWS order backlog soared by 189% to $578 billion, and the CEO made the rare promise that growth will exceed 40% in 2027-2028, aiming for $1 trillion in revenue within five to ten years. However, advertising business growth plunged from 26% to 12%, and capital expenditure reached $77.3 billion, far exceeding expectations, causing the stock price to fall 7% after hours. While major Wall Street banks collectively maintain their “buy” ratings, they admit that the structural risks posed by AI agents to the advertising ecosystem remain unresolved.

华尔街见闻•2026/10/30 08:23