
Gold (XAUUSD) Daily Technical Analysis: Falling Wedge Formation and Key Price Levels
Looking at Gold's daily chart, I can see that the market has developed a clear downward structure over recent months. Following the peak around 5,597 USD, selling pressure has continued, with lower highs and gradually narrowing price movements.
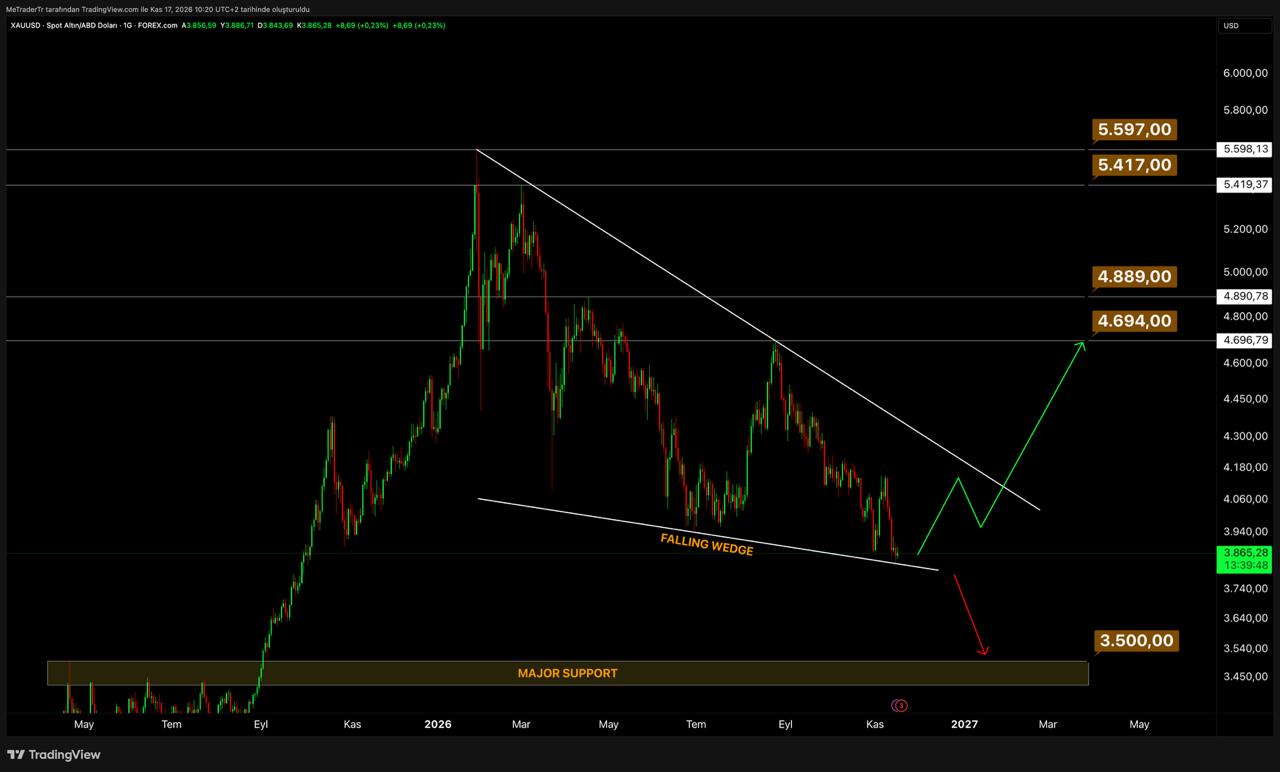
The most important technical formation I am currently monitoring is a potential falling wedge.
A falling wedge develops when price moves between two downward-sloping trendlines that gradually converge. This formation is often associated with a potential bullish reversal, but its presence alone does not confirm that a reversal will take place.
Falling Wedge and Market Structure
The upper trendline on the chart shows a steeper decline, while the lower boundary is moving downward at a slower pace.
This creates a narrowing price structure. However, Gold remains under the influence of the broader descending trend.
From my perspective, the important factor is not how long price remains within the wedge, but which direction it eventually breaks and how the market reacts after that breakout.
Bullish Scenario
A recovery from the current area, followed by a breakout above the upper boundary of the falling wedge, would be the first important development supporting a bullish scenario.
However, I would not consider a temporary move above the trendline sufficient confirmation.
I would prefer to see a decisive daily candle close above the descending resistance line, followed by sustained price action above the breakout area.
If these conditions develop, the first major resistance level I will be monitoring is 4,694 USD.
A confirmed breakout and sustained price action above 4,694 USD could bring the next resistance area around 4,889 USD into focus.
If the recovery develops into a broader bullish structure, the higher resistance levels at 5,417 and 5,597 USD may also become relevant.
Nevertheless, I do not consider these levels guaranteed price targets. A stronger bullish outlook would require a confirmed breakout from the descending structure, supported by improving price action and continued buying interest.
Bearish Scenario
On the other hand, if Gold breaks below the lower boundary of the falling wedge and confirms the move with a daily candle close, the existing bearish pressure could continue.
Under this scenario, the major support zone around 3,500 USD would become an important area to monitor.
This region has previously attracted buying interest and represents a significant historical price area on the chart.
However, support zones do not necessarily hold on every test. If Gold returns to this region, the strength of the buying reaction, candle structure and ability to maintain price above the zone will be important factors in assessing the market.
Market Outlook
My current assessment is that Gold remains within a broader bearish market structure on the daily timeframe.
At the same time, the narrowing price action within the falling wedge suggests that a significant directional move may develop as the formation progresses.
A confirmed breakout above the upper trendline could support a recovery towards 4,694 USD, followed by 4,889 USD if buying pressure continues.
Alternatively, a confirmed breakdown below the lower boundary of the wedge could shift attention towards the major support area around 3,500 USD.
For now, I prefer to focus on market structure, trendlines and price reactions at key support and resistance levels rather than anticipate a reversal before sufficient technical confirmation develops.
When analyzing formations such as a falling wedge, I consider the price behavior following a breakout just as important as the breakout itself.
MeTrader
Technical Market Analyst
Disclaimer: This article is contributed by a Bitget trader. The views expressed are the author’s own, do not necessarily reflect those of Bitget, and should not be considered financial or investment advice. Trading involves significant risk, and technical scenarios may change depending on market conditions. Qualified professionals should be consulted prior to making financial decisions.


- Falling Wedge and Market Structure
- Bullish Scenario
- Bearish Scenario
- Market Outlook

 Why Retail Investors Are Rushing Into the Anthropic IPO2026-11-17 | 5m